Prices Forecast: Technical Analysis
For the daily forecast, VeChain is expected to close at approximately $0.0251, with a potential range between $0.0245 and $0.0257. The weekly forecast suggests a closing price of around $0.0253, with a range from $0.0248 to $0.0259. The RSI is currently at 48.1717, indicating a neutral trend, while the ATR at 0.0014 suggests low volatility. The ADX at 19.232 shows a weak trend, implying that significant price movements are unlikely in the short term. The MACD line is slightly above the signal line, hinting at a potential bullish crossover, but the histogram’s negative values suggest caution. The economic calendar shows no significant events that could impact VeChain’s price, keeping the focus on technical indicators for guidance.
Fundamental Overview and Analysis
VeChain has experienced a relatively stable price trend recently, with minor fluctuations. The asset’s value is influenced by its supply chain solutions and partnerships with major companies. Investor sentiment appears cautiously optimistic, as reflected in the neutral RSI and low ADX values. Opportunities for growth include expanding its use cases and partnerships, while challenges involve competition from other blockchain platforms and regulatory uncertainties. Currently, VeChain seems fairly priced, given its technological advancements and market position. However, market volatility and external economic factors could pose risks to its valuation.
Outlook for VeChain
VeChain’s future outlook remains cautiously optimistic, with potential developments in supply chain technology and increased adoption. Historical price movements show a stable trend, with low volatility as indicated by the ATR. Economic conditions and technological advancements are likely to influence its price in the near future. In the short term (1 to 6 months), VeChain’s price is expected to remain stable, with minor fluctuations due to market sentiment and macroeconomic factors. Long-term forecasts (1 to 5 years) suggest potential growth, driven by increased adoption and technological innovations. However, external factors such as regulatory changes and market dynamics could significantly impact its price.
Technical Analysis
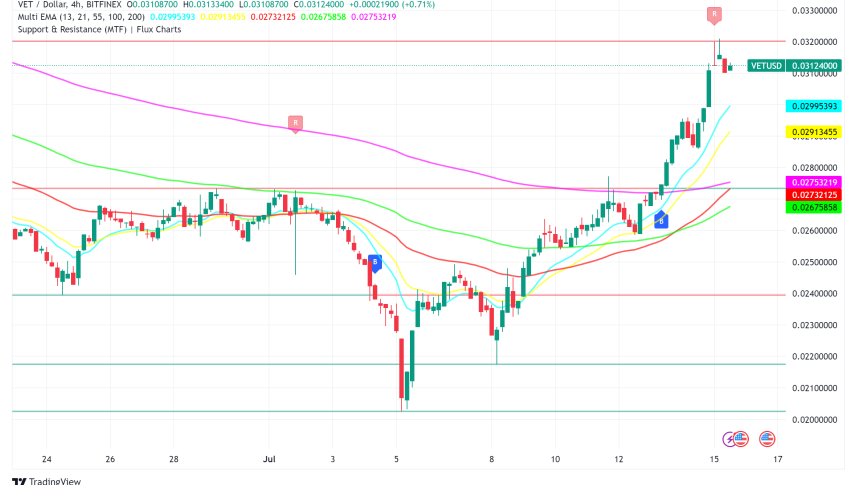
Current Price Overview: VeChain’s current price is $0.0249, slightly below the previous close of $0.0251. Over the last 24 hours, the price has shown minor downward movement with low volatility, as indicated by the ATR.Support and Resistance Levels: Key support levels are at $0.0245, $0.0242, and $0.0240, while resistance levels are at $0.0253, $0.0255, and $0.0257. The pivot point is at $0.03, with VeChain trading below it, suggesting a bearish sentiment.Technical Indicators Analysis: The RSI at 48.1717 indicates a neutral trend, while the ATR at 0.0014 suggests low volatility. The ADX at 19.232 shows a weak trend, and the 50-day SMA is slightly below the 200-day EMA, indicating no significant crossover.Market Sentiment & Outlook: Sentiment is currently neutral to bearish, with price action below the pivot and low ADX indicating weak trend strength. The lack of moving average crossover and low volatility further support this outlook.
Forecasting Returns: $1,000 Across Market Conditions
Investing $1,000 in VeChain under different market scenarios can yield varying returns. In a Bullish Breakout scenario, a 10% price increase could raise the investment to approximately $1,100. In a Sideways Range scenario, with a 0% change, the investment remains at $1,000. In a Bearish Dip scenario, a 10% decrease could reduce the investment to about $900. These scenarios highlight the importance of market conditions in determining investment outcomes. Investors should consider their risk tolerance and market outlook before making decisions. Diversifying investments and staying informed about market trends can help mitigate risks and optimize returns.
| Scenario | Price Change | Value After 1 Month |
|---|---|---|
| Bullish Breakout | +10% to ~$0.0274 | ~$1,100 |
| Sideways Range | 0% to ~$0.0249 | ~$1,000 |
| Bearish Dip | -10% to ~$0.0224 | ~$900 |
FAQs
What are the predicted price forecasts for the asset?
The daily forecast for VeChain suggests a closing price of approximately $0.0251, with a range between $0.0245 and $0.0257. The weekly forecast indicates a closing price around $0.0253, with a range from $0.0248 to $0.0259.
What are the key support and resistance levels for the asset?
Key support levels for VeChain are at $0.0245, $0.0242, and $0.0240. Resistance levels are identified at $0.0253, $0.0255, and $0.0257. The pivot point is at $0.03, with the asset currently trading below it.
Disclaimer
In conclusion, while the analysis provides a structured outlook on the asset’s potential price movements, it is essential to remember that financial markets are inherently unpredictable. Conducting thorough research and staying informed about market trends and economic indicators is crucial for making informed investment decisions.