Prices Forecast: Technical Analysis
For the daily forecast, Polkadot is expected to close at approximately $3.94, with a potential range between $3.88 and $3.99. The weekly forecast suggests a closing price of around $4.05, with a range from $3.84 to $4.09. The RSI is currently at 46.1691, indicating a neutral trend, while the ATR at 0.1919 suggests moderate volatility. The ADX at 13.8562 reflects a weak trend, implying that significant price movements are unlikely in the short term. The MACD line is slightly above the signal line, hinting at a potential bullish crossover, but the histogram shows a decreasing momentum. The economic calendar shows no significant events that could impact Polkadot’s price, suggesting that technical indicators will primarily drive the price action.
Fundamental Overview and Analysis
Polkadot has experienced a relatively stable price trend recently, with minor fluctuations. The asset’s value is influenced by its technological advancements and the growing interest in decentralized finance (DeFi) applications. Investor sentiment remains cautiously optimistic, as reflected in the moderate trading volumes. Opportunities for Polkadot’s growth include its scalability and potential for cross-chain interoperability, which could attract more developers and projects. However, challenges such as competition from other blockchain platforms and regulatory uncertainties pose risks. Currently, Polkadot appears to be fairly priced, with its valuation reflecting its technological potential and market position.
Outlook for Polkadot
The future outlook for Polkadot is cautiously optimistic, with potential developments in its ecosystem likely to drive growth. Historical price movements show a pattern of gradual increases, with occasional volatility spikes. In the short term (1 to 6 months), Polkadot’s price is expected to remain stable, with minor upward movements driven by technological advancements and increased adoption. Long-term forecasts (1 to 5 years) suggest significant growth potential, supported by Polkadot’s scalability and interoperability features. However, external factors such as regulatory changes and market dynamics could impact its price. Investors should monitor geopolitical issues and industry innovations that could influence Polkadot’s market position.
Technical Analysis
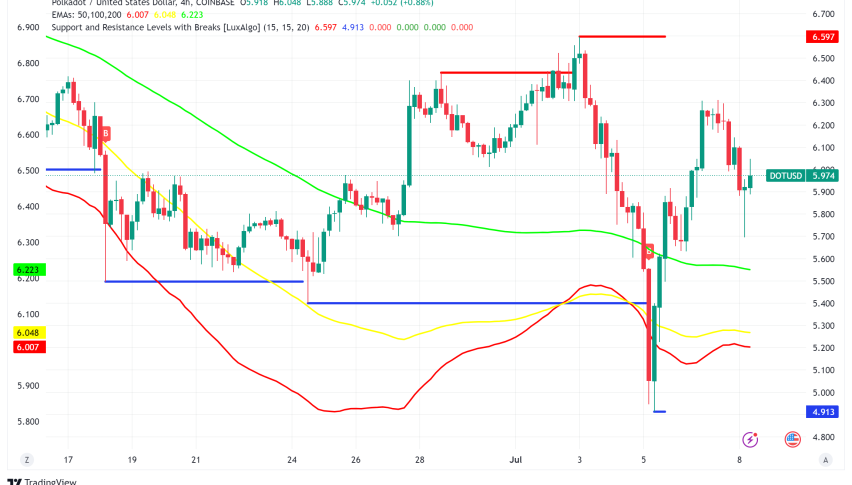
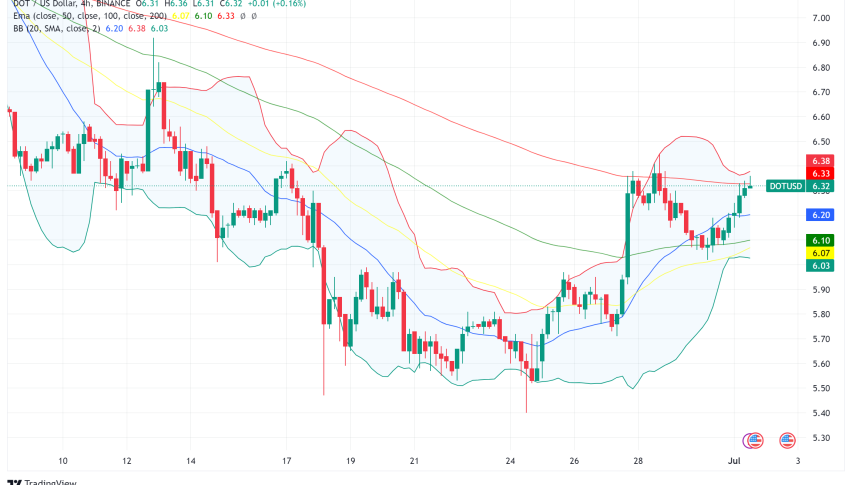
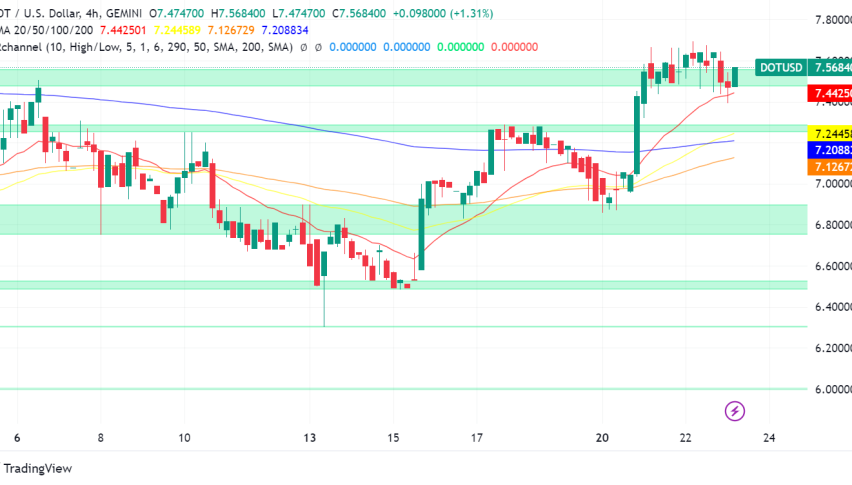
Current Price Overview: The current price of Polkadot is $3.9195, slightly below the previous close of $3.94. Over the last 24 hours, the price has shown a slight downward trend with moderate volatility, as indicated by the ATR. Support and Resistance Levels: Key support levels are at $3.88, $3.84, and $3.77, while resistance levels are at $3.99, $4.05, and $4.09. The pivot point is at $3.94, with Polkadot trading slightly below it, suggesting a neutral to bearish sentiment. Technical Indicators Analysis: The RSI at 46.1691 indicates a neutral trend, while the ATR at 0.1919 suggests moderate volatility. The ADX at 13.8562 reflects a weak trend, and the 50-day SMA is slightly above the 200-day EMA, indicating no significant crossover. Market Sentiment & Outlook: Sentiment is currently neutral to bearish, with price action below the pivot and RSI indicating a lack of strong momentum. The ATR suggests moderate volatility, and the absence of a moving average crossover supports a cautious outlook.
Forecasting Returns: $1,000 Across Market Conditions
Investing $1,000 in Polkadot presents various scenarios based on market conditions. In a Bullish Breakout scenario, a 10% price increase could raise the investment to approximately $1,100. In a Sideways Range scenario, the price might remain stable, keeping the investment around $1,000. In a Bearish Dip scenario, a 10% decrease could reduce the investment to about $900. These scenarios highlight the importance of market conditions in determining investment outcomes. Investors should consider their risk tolerance and market outlook when deciding to invest in Polkadot. Monitoring technical indicators and market trends can provide valuable insights for making informed investment decisions.
| Scenario | Price Change | Value After 1 Month |
|---|---|---|
| Bullish Breakout | +10% to ~$4.31 | ~$1,100 |
| Sideways Range | 0% to ~$3.92 | ~$1,000 |
| Bearish Dip | -10% to ~$3.53 | ~$900 |
FAQs
What are the predicted price forecasts for the asset?
The daily forecast for Polkadot suggests a closing price of approximately $3.94, with a range between $3.88 and $3.99. The weekly forecast indicates a closing price around $4.05, with a range from $3.84 to $4.09.
What are the key support and resistance levels for the asset?
Key support levels for Polkadot are at $3.88, $3.84, and $3.77. Resistance levels are identified at $3.99, $4.05, and $4.09. The pivot point is at $3.94, with the asset currently trading slightly below it.
What are the main factors influencing the asset’s price?
Polkadot’s price is influenced by technological advancements, investor sentiment, and market dynamics. Its scalability and interoperability features offer growth opportunities, while competition and regulatory uncertainties pose challenges.
What is the outlook for the asset in the next 1 to 6 months?
In the short term, Polkadot’s price is expected to remain stable with minor upward movements driven by technological advancements and increased adoption. However, external factors such as regulatory changes and market dynamics could impact its price.
Disclaimer
In conclusion, while the analysis provides a structured outlook on the asset’s potential price movements, it is essential to remember that financial markets are inherently unpredictable. Conducting thorough research and staying informed about market trends and economic indicators is crucial for making informed investment decisions.