Prices Forecast: Technical Analysis
For the daily forecast, ANKR-USD is expected to close around $0.0185, with a potential range between $0.0180 and $0.0190. The weekly forecast suggests a closing price of approximately $0.0190, with a range from $0.0185 to $0.0195. The RSI is currently at 44.5436, indicating a neutral to slightly bearish sentiment, while the ATR at 0.0011 suggests low volatility. The MACD line is slightly negative, hinting at a bearish momentum. The ADX at 22.614 indicates a weak trend, suggesting that the price might not experience significant directional movement in the short term. The economic calendar shows no significant events that could impact ANKR-USD, keeping the focus on technical indicators for price predictions.
Fundamental Overview and Analysis
Recently, ANKR-USD has shown a downward trend, with the last closing price at $0.0181. The market behavior reflects a cautious sentiment among investors, likely due to the lack of significant economic drivers. The asset’s value is influenced by its utility in decentralized finance and blockchain infrastructure, but competition and market volatility pose challenges. Investor sentiment appears neutral, with no major news affecting the asset. Opportunities for growth exist in expanding its use cases and partnerships. However, risks include regulatory changes and technological advancements by competitors. Currently, ANKR-USD seems fairly priced, given its market position and potential for future growth.
Outlook for Ankr
The future outlook for ANKR-USD is cautiously optimistic, with potential for moderate growth. Historical price movements show a pattern of volatility, but recent stability suggests a consolidation phase. Economic conditions and technological advancements will likely influence its price. In the short term (1 to 6 months), ANKR-USD may see slight upward movement, potentially reaching $0.0200, driven by market sentiment and technical factors. Long-term forecasts (1 to 5 years) depend on the asset’s ability to innovate and expand its market presence. External factors such as regulatory changes or industry innovations could significantly impact its price. Overall, ANKR-USD’s outlook is stable, with potential for growth if market conditions remain favorable.
Technical Analysis
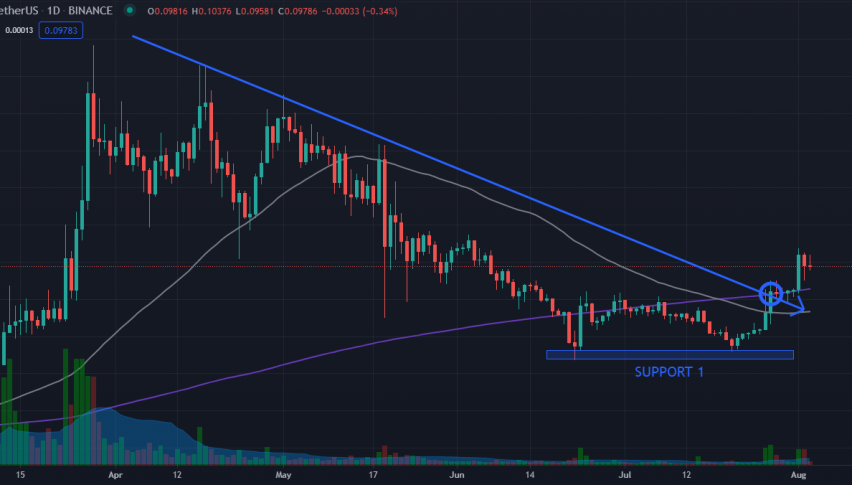
Current Price Overview: The current price of ANKR-USD is $0.0181, slightly lower than the previous close of $0.0181. Over the last 24 hours, the price has shown minimal movement, indicating low volatility. Support and Resistance Levels: Key support levels are at $0.0180, $0.0175, and $0.0170, while resistance levels are at $0.0190, $0.0195, and $0.0200. The pivot point is at $0.0200, with the asset trading below it, suggesting a bearish sentiment. Technical Indicators Analysis: The RSI at 44.5436 suggests a neutral trend, while the ATR of 0.0011 indicates low volatility. The ADX at 22.614 shows a weak trend. The 50-day SMA and 200-day EMA do not show a crossover, indicating no significant trend change. Market Sentiment & Outlook: Sentiment is currently neutral to bearish, with price action below the pivot, a neutral RSI, and low volatility. The lack of a moving average crossover supports this sentiment.
Forecasting Returns: $1,000 Across Market Conditions
Investing $1,000 in ANKR-USD presents various scenarios based on market conditions. In a Bullish Breakout, a 10% increase could raise the investment to approximately $1,100. In a Sideways Range, the investment might remain around $1,000, reflecting minimal price change. In a Bearish Dip, a 10% decrease could lower the investment to about $900. These scenarios highlight the importance of market conditions in investment decisions. Investors should consider their risk tolerance and market outlook before investing. Diversification and regular market analysis can help mitigate risks and optimize returns.
| Scenario | Price Change | Value After 1 Month |
|---|---|---|
| Bullish Breakout | +10% to ~$0.0199 | ~$1,100 |
| Sideways Range | 0% to ~$0.0181 | ~$1,000 |
| Bearish Dip | -10% to ~$0.0163 | ~$900 |
FAQs
What are the predicted price forecasts for the asset?
The daily forecast for ANKR-USD is a closing price of $0.0185, with a range between $0.0180 and $0.0190. The weekly forecast suggests a closing price of $0.0190, with a range from $0.0185 to $0.0195.
What are the key support and resistance levels for the asset?
Key support levels for ANKR-USD are at $0.0180, $0.0175, and $0.0170. Resistance levels are at $0.0190, $0.0195, and $0.0200. The pivot point is at $0.0200, with the asset trading below it.
What are the main factors influencing the asset’s price?
ANKR-USD’s price is influenced by its utility in decentralized finance, market sentiment, and technical indicators. Competition, regulatory changes, and technological advancements also play significant roles.
What is the outlook for the asset in the next 1 to 6 months?
In the short term, ANKR-USD may see slight upward movement, potentially reaching $0.0200, driven by market sentiment and technical factors. The outlook is stable, with potential for moderate growth if market conditions remain favorable.
Disclaimer
In conclusion, while the analysis provides a structured outlook on the asset’s potential price movements, it is essential to remember that financial markets are inherently unpredictable. Conducting thorough research and staying informed about market trends and economic indicators is crucial for making informed investment decisions.