ORDI Soars 13%: Bitcoin Ordinals Craze Fuels Token Rally
The price of Ordinals (ORDI), the self-proclaimed "official token of Bitcoin inscriptions," surged over 13% in the past 24 hours, reaching a
•
Last updated: Tuesday, February 13, 2024
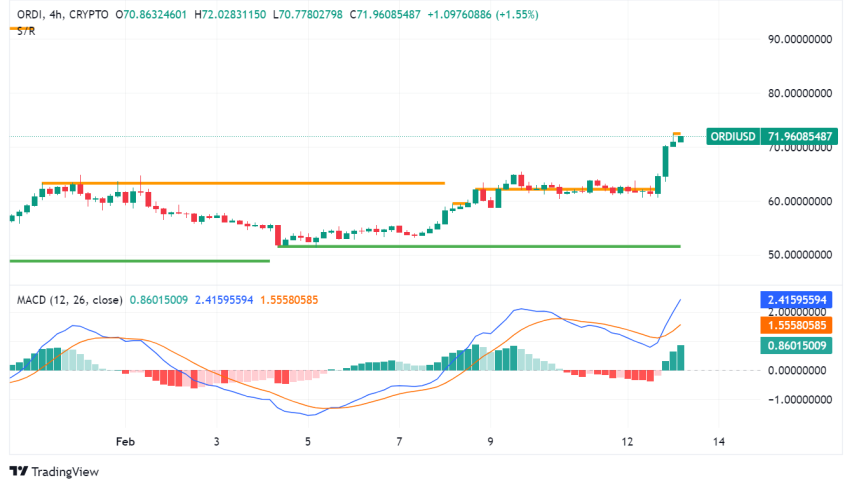

The price of Ordinals (ORDI), the self-proclaimed “official token of Bitcoin inscriptions,” surged over 13% in the past 24 hours, reaching a high of $72.08. This rally comes amidst growing excitement surrounding the recently launched Bitcoin Ordinals protocol, which allows inscribing data directly onto the Bitcoin blockchain.
Why the Spike?
Several factors seem to be driving the rise of ORDI:
- Bitcoin Ordinals Hype: The ability to inscribe text, images, and other media onto the Bitcoin blockchain has sparked significant interest, attracting new users and developers to the Ordinals ecosystem.
- Potential Use Cases: Ordinals open doors for NFTs, digital collectibles, and on-chain games, potentially unlocking new economic activity within the Bitcoin network.
- Investment Speculation: Some investors see ORDI as a way to gain exposure to the Ordinals ecosystem and its potential future growth.
Binance Research Weighs In
A recent report by Binance Research highlighted both the opportunities and challenges associated with Ordinals:
- Opportunities: Increased Bitcoin blockchain activity could attract developers and users, potentially benefiting the entire ecosystem.
- Challenges: Ordinals might raise concerns about scalability and spam on the Bitcoin network, requiring technical solutions and community consensus.
Bitcoin Ordinals Fee Milestone
Notably, Ordinals inscriptions have already generated over 6,000 BTC in fees since their launch last week. This significant figure suggests both user demand and potential revenue for the Ordinals ecosystem.
Technical Analysis of ORDI/USD
- Current Price: $71.9
- Recent Trend: Uptrend, with support around $52 and resistance near $65
- Moving Averages: Short-term MAs suggest continued bullishness, while longer-term MAs remain flat.
- Technical Indicators: RSI is approaching overbought territory, indicating potential for a pullback.
- Check out our free forex signals
- Follow the top economic events on FX Leaders economic calendar
- Trade better, discover more Forex Trading Strategies
- Open a FREE Trading Account
- Read our latest reviews on: Avatrade, Exness, HFM and XM
ABOUT THE AUTHOR
See More
Arslan Butt
Index & Commodity Analyst
improve security
Related Articles

1 year ago
Save
1 year ago
Save
Sidebar rates
Related Posts
Add 3440


