Pepe (PEPE) Surges Over 370%: Meme Mania Back or Just a Flash in the Pan?
The cryptocurrency market has witnessed a resurgence of memecoin interest, with Pepe (PEPE) leading the charge. This green frog-themed

The cryptocurrency market has witnessed a resurgence of memecoin interest, with Pepe (PEPE) leading the charge. This green frog-themed token has skyrocketed over 370% in the past week, leaving many wondering what’s fueling the rally. Here’s a breakdown of the potential reasons behind PEPE’s surge:
1. Broader Memecoin Rally
The overall cryptocurrency market surpassing $2 trillion and Bitcoin nearing $64,000 has triggered a general improvement in sentiment, particularly towards memecoins. Other memecoins like Dogwifhat (WIF), Dogecoin (DOGE), and Bonk (BONK) have also seen significant gains, indicating a broader trend.
2. Whale Portfolio Diversification
A major crypto whale recently shifted their holdings from another successful memecoin to Shiba Inu (SHIB). This suggests a potential rotation within the memecoin space, with some investors seeking new opportunities.
The whale’s $6 million PEPE investment and subsequent purchase of SHIB could be interpreted as a lack of confidence in PEPE’s continued growth potential.
3. PEPE/USD Technical Outlook
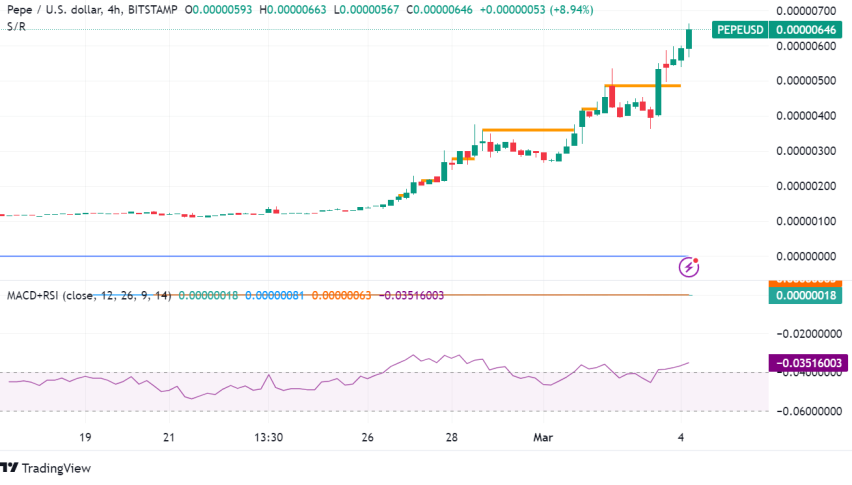
Since late February, PEPE has embarked on a significant rally, bouncing from $0.00000115 to its current price of $0.00000435 (a 280% increase). The daily chart suggests a bullish reversal pattern known as a rounding bottom, indicating a potential shift from a bearish to a bullish trend.
A crucial breakout point sits at the $0.00000448 neckline resistance. If breached, it could trigger increased buying pressure and push the price towards a potential target of $0.00000836.
Technical Analysis (PEPE/USD)
- Current Price: $0.00000646
- Recent Trend: Strong uptrend with a 370% gain in the past week.
- Resistance Levels: $0.0000070 followed by $0.00000836.
- Support Levels: $0.0000050 (immediate support), followed by $0.00000115 (previous low).
- Indicators: The Relative Strength Index (RSI) is currently hovering above 70, indicating overbought territory. This suggests a potential short-term pullback before the uptrend resumes.
- Check out our free forex signals
- Follow the top economic events on FX Leaders economic calendar
- Trade better, discover more Forex Trading Strategies
- Open a FREE Trading Account
- Read our latest reviews on: Avatrade, Exness, HFM and XM
Related Articles
Sidebar rates
Related Posts
Add 3440


