Bearish Break in GBP/USD and GBP to INR!
The rate of GBP to INR fell below 105 yesterday, while GBP/USD headed for 125, after breaking the 200 daily SMA
The rate of GBP to INR fell below 105 yesterday, while GBP/USD headed for 125, after breaking the 200 daily SMA. The BRC Shop Price Index which was released early in the morning and the final PMI manufacturing index didn’t do much to help the situation for the GBP. So, as with other major pairings this week, all eyes will be on the upcoming US jobs reports, particularly the NFP scheduled for Friday, potentially limiting any major reaction to other news until then.
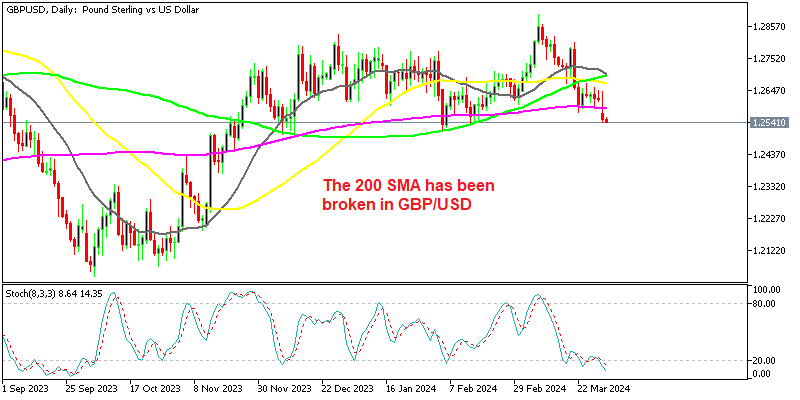
GBP/USD Chart Daily – The 200 SMA Has Been Broken
Consequently, GBP/USD may continue to trade within the range outlined above. The 100-day moving average (green line) was acting as a resistance level last week, while the 200-day moving average (purple line) was acting as support, but that was broken yesterday after the impressive US ISM manufacturing report. The key levels to watch are 1.2650 where the 100 SMA stands and 1.26 where the 200 SMA stands respectively.
The move below the 200-day moving average has motivated sellers to target the February lows above 1.25. However, as we said, this week the pound’s influence may be limited, with much of the focus on the Dollar side of the trade. Therefore, market participants will closely monitor the US labour reports during the week, Fed speakers and overall market sentiment leading up to the US jobs report.
GBP/INR Chart Daily – The Price is Below 1.05
GBP/INR has been making lower highs since it failed to reach 1.07, following the rally in Q4 of last year. However, the 100 SMA (green) was acting as support on the daily chart, pushing the lows higher. In the last several days though, the price was getting squeezed between this moving average and the 50 SMA (yellow) which was acting as resistance at the top. Now sellers are facing the 200 SMA after the break of the 100 SMA.
GBP/USD Live Chart
- Check out our free forex signals
- Follow the top economic events on FX Leaders economic calendar
- Trade better, discover more Forex Trading Strategies
- Open a FREE Trading Account
- Read our latest reviews on: Avatrade, Exness, HFM and XM
Related Articles
Sidebar rates
Related Posts
Add 3440


