Chainlink Price Analysis: Record 1,659 Whale Transactions Signal 180% Growth Potential, LINK Exchange Holdings Hit 3-Month Low
With whale activity at its greatest levels in 14 months, Chainlink (LINK) is displaying strong indicators of institutional interest, maybe
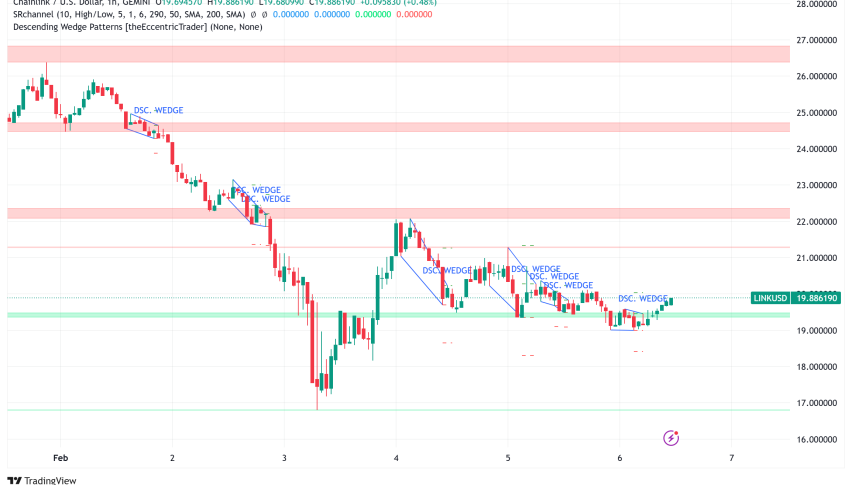
Live LINK/USD Chart

With whale activity at its greatest levels in 14 months, Chainlink (LINK) is displaying strong indicators of institutional interest, maybe signaling a major price shift.

Notwithstanding recent price corrections, the distributed oracle network has seen hitherto unheard-of volume of transactions, implying purposeful accumulation by significant players.
Chainlink Whale Activity and Network Metrics
Data on the on-chain monitoring platform Santiment shows Chainlink recorded 1,659 daily transactions surpassing $100,000, the highest number since December 2023. The most notable activity in four weeks—the network registered 9,531 distinct active addresses—indicating strong network involvement despite market instability.
Complementing the positive attitude, LINK’s exchange balances have declined significantly, from 157.6 million to 147 million tokens – the lowest level since mid-December. Usually, this drop in exchange holdings indicates less selling pressure as investors transfer assets to long-term storage.
Chainlink’s Strong Fundamentals Support LINK Rally
Chainlink’s fundamental position remains robust, supported by several key factors:
- Market Leadership: Chainlink maintains its dominance in the oracle sector with a 55% market share and secures approximately $33 billion in total value.
- Strategic Partnerships: The project has secured collaborations with major financial institutions including UBS, Coinbase, Swift, Fidelity, and Lemonade.
- Real-World Asset (RWA) Integration: Chainlink’s Cross-Chain Interoperability Protocol plays a crucial role in the growing RWA tokenization sector, with major Wall Street firms like BlackRock, Franklin Templeton, and Apollo actively participating.
- Staking Yield: The network offers a competitive 4.32% staking yield, with over 40.8 million LINK tokens currently staked.
LINK/USD Technical Analysis and Price Action
LINK/USD, trading at $19.97 right now, has seen a notable drop, almost 40% from its 2025 peak. Consolidating between its 50-day moving average at $22.76 and 200-day moving average at $15.88, the asset creates a critical technical position that might define its next significant movement.
Technical indicators reveal several notable patterns:
- A cup-and-handle formation developed between 2022 and late 2024
- A falling wedge pattern with converging trendlines
- Strong support established near $16.91
- Key resistance levels at $21.00 and $25.00
Based on the completion of the cup-and-handle formation, technical experts note a probable advance to $54.30, a 180% increase from present levels. But below $15.60, this optimistic view would be invalidated.
Chainlink Price Prediction
Market analysts remain predominantly bullish on LINK’s prospects. CoinCodex projects a potential surge to $32 by the end of February, representing a 27% increase from current levels. More optimistic forecasts suggest the asset could reach $41 in March and potentially $48 by May 2025, which would mark a new yearly high.
Technical analysts point to a possible rise to $54.30, representing a 180% increase from current levels, based on the completion of the cup-and-handle pattern. However, a drop below $15.60 would invalidate this bullish outlook.
Investors should keep note of important support around $19.50 and resistance at $21.00 since breaking either level could cause accelerated price movement in that direction. Determining LINK’s path through 2025 would probably depend much on the larger market conditions and ongoing institutional acceptance of RWA solutions.
- Check out our free forex signals
- Follow the top economic events on FX Leaders economic calendar
- Trade better, discover more Forex Trading Strategies
- Open a FREE Trading Account
- Read our latest reviews on: Avatrade, Exness, HFM and XM
Related Articles


Sidebar rates
Related Posts
Add 3440


