Prices Forecast: Technical Analysis
For the daily forecast, the USD/SGD is expected to close around 1.29, with a potential range between 1.28 and 1.30. The weekly forecast suggests a closing price of approximately 1.28, with a range from 1.27 to 1.31. The RSI at 28.9987 indicates an oversold condition, suggesting a potential for a bullish reversal. However, the ATR at 0.0107 points to increased volatility, which could lead to further price fluctuations. The ADX at 35.4724 suggests a strong trend, but the negative directional movement (D-) is significantly higher than the positive (D+), indicating bearish momentum. The MACD line is below the signal line, reinforcing the bearish sentiment. The Bollinger Bands show the price nearing the lower band, which could act as support. Overall, the technical indicators suggest a cautious approach, with potential for short-term recovery if the oversold conditions trigger buying interest.
Fundamental Overview and Analysis
Recently, USD/SGD has shown a downward trend, with the last closing price at 1.2881. This decline is influenced by macroeconomic factors such as the US ISM Services PMI forecasted to decrease, indicating potential economic slowdown. The asset’s value is also affected by the relative strength of the US dollar and Singapore’s economic stability. Investor sentiment appears cautious, with traders closely monitoring economic indicators for signs of recovery. Opportunities for growth may arise if the US economy shows resilience, but risks include potential regulatory changes and global economic uncertainties. The current valuation suggests the asset might be undervalued, given the oversold RSI. However, market volatility remains a concern, and traders should be prepared for potential fluctuations. Overall, while there are growth opportunities, the asset faces significant challenges that could impact its performance.
Outlook for USD/SGD
The future outlook for USD/SGD is mixed, with short-term volatility expected due to economic data releases and global market conditions. Historical price movements show a bearish trend, but the oversold RSI suggests a potential for a short-term rebound. Key factors influencing the price include US economic data, Singapore’s economic performance, and global market sentiment. In the short term (1 to 6 months), the price may stabilize around the pivot point of 1.29, with potential upward movement if economic conditions improve. Long-term forecasts (1 to 5 years) depend on macroeconomic trends, with potential risks from geopolitical tensions and market disruptions. External factors such as changes in US monetary policy or Singapore’s economic policies could significantly impact the asset’s price. Overall, while there are opportunities for growth, traders should remain vigilant and consider both short-term and long-term risks.
Technical Analysis
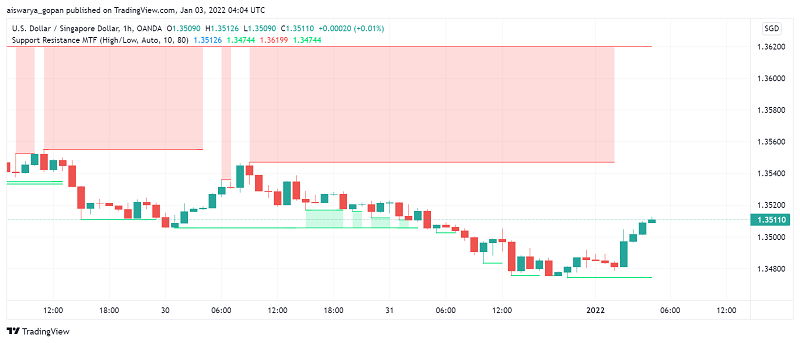
Current Price Overview: The current price of USD/SGD is 1.2881, slightly below the previous close of 1.29. Over the last 24 hours, the price has shown a downward trend with increased volatility, as indicated by the ATR. Support and Resistance Levels: Key support levels are at 1.28, 1.28, and 1.27, while resistance levels are at 1.3, 1.31, and 1.31. The pivot point is at 1.29, and the asset is trading below it, suggesting bearish sentiment. Technical Indicators Analysis: The RSI at 28.9987 indicates an oversold condition, suggesting potential for a bullish reversal. The ATR at 0.0107 indicates high volatility. The ADX at 35.4724 shows a strong trend, but the negative directional movement suggests bearish momentum. The 50-day SMA and 200-day EMA do not show a crossover, indicating no significant trend change. Market Sentiment & Outlook: Sentiment is currently bearish, with the price trading below the pivot, a low RSI, and a strong ADX indicating a prevailing downtrend. The lack of a moving average crossover suggests the bearish trend may continue.
Forecasting Returns: $1,000 Across Market Conditions
The table below outlines potential returns on a $1,000 investment in USD/SGD under different market scenarios. In a Bullish Breakout scenario, a 10% price increase could raise the investment value to approximately $1,100. In a Sideways Range scenario, with a 0% change, the investment remains at $1,000. In a Bearish Dip scenario, a 10% decrease could reduce the investment to around $900. These scenarios highlight the importance of market conditions on investment outcomes. Investors should consider their risk tolerance and market outlook when deciding to invest. A bullish breakout could offer significant returns, but the current bearish sentiment suggests caution. Monitoring economic indicators and technical signals can help in making informed decisions. Diversifying investments and setting stop-loss orders can mitigate potential losses. Overall, while there are opportunities for profit, investors should remain cautious and prepared for market volatility.
| Scenario | Price Change | Value After 1 Month |
|---|---|---|
| Bullish Breakout | +10% to ~$1,100 | ~$1,100 |
| Sideways Range | 0% to ~$1,000 | ~$1,000 |
| Bearish Dip | -10% to ~$900 | ~$900 |
FAQs
What are the predicted price forecasts for the asset?
The daily forecast for USD/SGD suggests a closing price of around 1.29, with a range between 1.28 and 1.30. The weekly forecast indicates a closing price of approximately 1.28, with a range from 1.27 to 1.31. These predictions are based on technical indicators such as RSI and ATR, which suggest potential volatility and oversold conditions.
What are the key support and resistance levels for the asset?
Key support levels for USD/SGD are at 1.28, 1.28, and 1.27, while resistance levels are at 1.3, 1.31, and 1.31. The pivot point is at 1.29, and the asset is currently trading below it, indicating bearish sentiment. These levels are crucial for traders to identify potential entry and exit points.
Disclaimer
In conclusion, while the analysis provides a structured outlook on the asset’s potential price movements, it is essential to remember that financial markets are inherently unpredictable. Conducting thorough research and staying informed about market trends and economic indicators is crucial for making informed investment decisions.