Prices Forecast: Technical Analysis
For the daily forecast, Aluminum is expected to close around $2,321.50, with a potential range between $2,300 and $2,350. The weekly forecast suggests a closing price of approximately $2,350, with a range from $2,320 to $2,380. The RSI is currently at 44.26, indicating a neutral to slightly bearish sentiment, while the ATR at 34.45 suggests moderate volatility. The ADX at 17.03 reflects a weak trend, implying that significant price movements are unlikely in the short term. The MACD histogram shows a negative value, reinforcing the bearish outlook. However, the proximity of the price to the pivot point of $2,326.83 suggests potential support, which could limit downside risks. Overall, the technical indicators suggest a cautious approach, with a slight bearish bias in the short term.
Fundamental Overview and Analysis
Aluminum prices have shown a downward trend recently, influenced by global economic uncertainties and fluctuating demand. The asset’s value is primarily driven by supply and demand dynamics, with recent economic data indicating a slowdown in manufacturing activity, particularly in Europe and China. Investor sentiment remains cautious, as reflected in the technical indicators. Opportunities for growth exist in the form of increased demand from the automotive and construction sectors, but these are tempered by risks such as regulatory changes and competition from alternative materials. The current valuation appears to be slightly undervalued, given the potential for demand recovery. However, market volatility and geopolitical tensions pose significant challenges. Overall, while there are growth opportunities, investors should remain vigilant about potential risks.
Outlook for Aluminum
The future outlook for Aluminum is mixed, with short-term pressures from economic slowdowns and long-term potential from industrial demand. Historical price movements show a recent decline, but the asset has the potential to recover as economic conditions stabilize. Key factors influencing future prices include global economic growth, supply chain disruptions, and technological advancements in production. In the short term (1 to 6 months), prices may remain under pressure, with potential recovery towards the end of the period. Long-term forecasts (1 to 5 years) are more optimistic, with expected growth driven by increased industrial use and potential supply constraints. External factors such as geopolitical issues and environmental regulations could significantly impact prices. Investors should consider these dynamics when making long-term investment decisions.
Technical Analysis
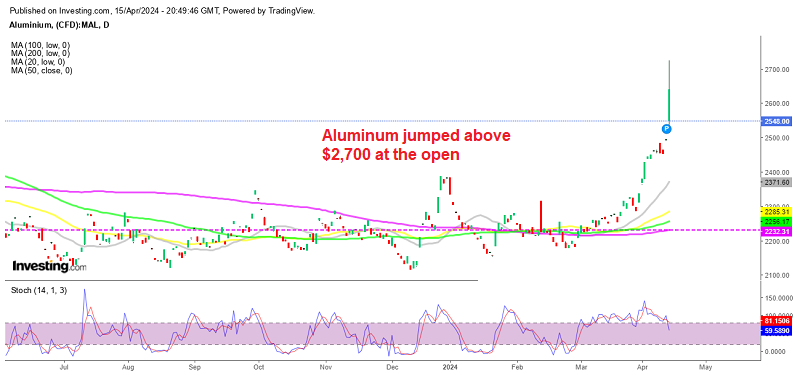
Current Price Overview: The current price of Aluminum is $2,321.50, slightly below the previous close of $2,345.00. Over the last 24 hours, the price has shown a downward trend with moderate volatility, as indicated by the ATR. Support and Resistance Levels: Key support levels are at $2,309.17, $2,296.83, and $2,279.17, while resistance levels are at $2,339.17, $2,356.83, and $2,369.17. The pivot point is $2,326.83, and the asset is trading below it, suggesting a bearish sentiment. Technical Indicators Analysis: The RSI at 44.26 indicates a neutral to bearish trend. The ATR of 34.45 suggests moderate volatility. The ADX at 17.03 shows a weak trend, indicating limited directional movement. The 50-day SMA and 200-day EMA do not show a crossover, suggesting no significant trend change. Market Sentiment & Outlook: Sentiment is currently bearish, as the price is below the pivot, and the RSI and ADX indicate weak momentum. The lack of a moving average crossover further supports this view. Investors should be cautious, given the moderate volatility indicated by the ATR.
Forecasting Returns: $1,000 Across Market Conditions
The table below outlines potential returns on a $1,000 investment in Aluminum under different market scenarios. In a Bullish Breakout scenario, a 10% price increase could raise the investment value to approximately $1,100. In a Sideways Range scenario, with a 0% change, the investment remains at $1,000. In a Bearish Dip scenario, a 10% decrease could reduce the investment to around $900. These scenarios highlight the importance of market conditions in determining investment outcomes. Investors should consider their risk tolerance and market outlook when deciding to invest. A diversified approach may help mitigate risks associated with market volatility. Monitoring economic indicators and technical signals can provide valuable insights for making informed decisions.
| Scenario | Price Change | Value After 1 Month |
|---|---|---|
| Bullish Breakout | +10% to ~$2,553 | ~$1,100 |
| Sideways Range | 0% to ~$2,321 | ~$1,000 |
| Bearish Dip | -10% to ~$2,089 | ~$900 |
FAQs
What are the predicted price forecasts for the asset?
The daily forecast for Aluminum suggests a closing price of around $2,321.50, with a range between $2,300 and $2,350. The weekly forecast anticipates a closing price of approximately $2,350, with a range from $2,320 to $2,380.
What are the key support and resistance levels for the asset?
Key support levels for Aluminum are at $2,309.17, $2,296.83, and $2,279.17. Resistance levels are at $2,339.17, $2,356.83, and $2,369.17. The pivot point is $2,326.83, and the asset is currently trading below it.
Disclaimer
In conclusion, while the analysis provides a structured outlook on the asset’s potential price movements, it is essential to remember that financial markets are inherently unpredictable. Conducting thorough research and staying informed about market trends and economic indicators is crucial for making informed investment decisions.