Prices Forecast: Technical Analysis
For the daily forecast, Cardano (ADA-USD) is expected to close around $0.67, with a potential range between $0.65 and $0.68. The weekly forecast suggests a closing price of approximately $0.68, with a range from $0.64 to $0.70. The RSI is currently at 46.53, indicating a neutral to slightly bearish sentiment. The ATR at 0.0376 suggests moderate volatility, while the ADX at 16.46 indicates a weak trend. The MACD line is slightly above the signal line, hinting at a potential bullish crossover. These indicators, combined with the pivot point at $0.67, suggest that ADA-USD might experience some consolidation before any significant movement.
Fundamental Overview and Analysis
Cardano has recently shown a mixed performance, with fluctuations in price driven by market sentiment and technical factors. The asset’s value is influenced by its technological advancements and the broader crypto market trends. Investor sentiment appears cautious, with a focus on regulatory developments and market volatility. Cardano’s scalability and potential for smart contract integration present growth opportunities. However, competition from other blockchain platforms and regulatory challenges pose risks. Currently, Cardano seems fairly valued, with its price reflecting both its potential and the uncertainties in the market.
Outlook for Cardano
Looking ahead, Cardano’s future appears promising, with potential developments in its blockchain technology and increased adoption. Historical price movements show a pattern of volatility, influenced by market events and investor sentiment. In the short term (1 to 6 months), Cardano’s price may fluctuate between $0.64 and $0.70, driven by economic conditions and technological advancements. Long-term forecasts (1 to 5 years) suggest potential growth, contingent on successful platform upgrades and market expansion. External factors, such as regulatory changes and market dynamics, could significantly impact Cardano’s price trajectory.
Technical Analysis
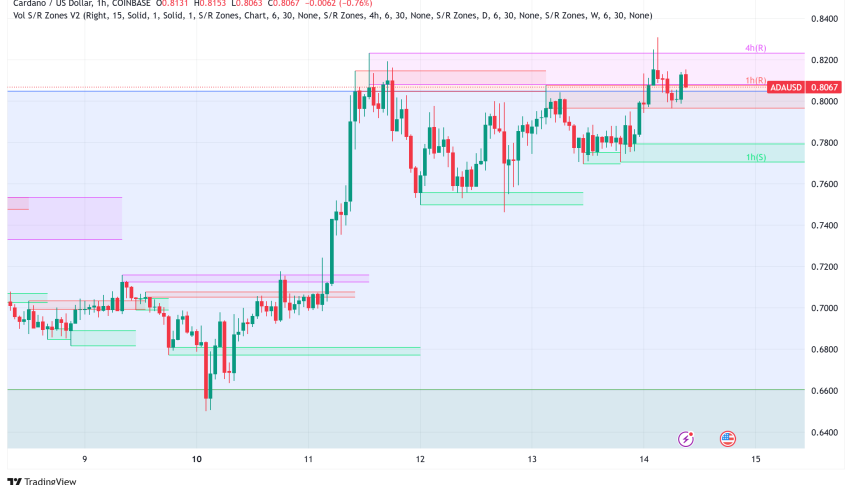
Current Price Overview: The current price of Cardano is $0.6624, slightly below the previous close of $0.6624. Over the last 24 hours, the price has shown minor fluctuations, indicating a stable market with moderate volatility.
Support and Resistance Levels: Key support levels are at $0.65, $0.64, and $0.62, while resistance levels are at $0.68, $0.70, and $0.71. The pivot point is at $0.67, with Cardano trading slightly below it, suggesting a neutral to bearish outlook.
Technical Indicators Analysis: The RSI at 46.53 suggests a neutral trend. The ATR of 0.0376 indicates moderate volatility. The ADX at 16.46 shows a weak trend. The 50-day SMA and 200-day EMA do not show a crossover, indicating no strong trend reversal.
Market Sentiment & Outlook: Sentiment is currently neutral to bearish, with price action below the pivot, a neutral RSI, and weak ADX. The lack of moving average crossover and moderate ATR-based volatility support this view.
Forecasting Returns: $1,000 Across Market Conditions
Investing $1,000 in Cardano under different market scenarios can yield varying results. In a Bullish Breakout scenario, a 10% price increase could raise the investment to approximately $1,100. In a Sideways Range scenario, the price might remain stable, keeping the investment around $1,000. In a Bearish Dip scenario, a 10% decrease could reduce the investment to about $900. These scenarios highlight the importance of understanding market conditions and potential price movements. Investors should consider their risk tolerance and market outlook when deciding to invest in Cardano.
| Scenario | Price Change | Value After 1 Month |
|---|---|---|
| Bullish Breakout | +10% to ~$0.73 | ~$1,100 |
| Sideways Range | 0% to ~$0.67 | ~$1,000 |
| Bearish Dip | -10% to ~$0.60 | ~$900 |
FAQs
What are the predicted price forecasts for the asset?
The daily forecast for Cardano suggests a closing price around $0.67, with a range between $0.65 and $0.68. The weekly forecast indicates a closing price of approximately $0.68, with a range from $0.64 to $0.70.
What are the key support and resistance levels for the asset?
Key support levels for Cardano are at $0.65, $0.64, and $0.62. Resistance levels are identified at $0.68, $0.70, and $0.71. The pivot point is at $0.67, with the asset currently trading slightly below it.
What are the main factors influencing the asset’s price?
Cardano’s price is influenced by technological advancements, market sentiment, and regulatory developments. The asset’s scalability and smart contract capabilities present growth opportunities, while competition and market volatility pose challenges.
What is the outlook for the asset in the next 1 to 6 months?
In the short term, Cardano’s price may fluctuate between $0.64 and $0.70, driven by economic conditions and technological advancements. Market sentiment and regulatory changes will also play a significant role in shaping its price trajectory.
Disclaimer
In conclusion, while the analysis provides a structured outlook on the asset’s potential price movements, it is essential to remember that financial markets are inherently unpredictable. Conducting thorough research and staying informed about market trends and economic indicators is crucial for making informed investment decisions.