Prices Forecast: Technical Analysis
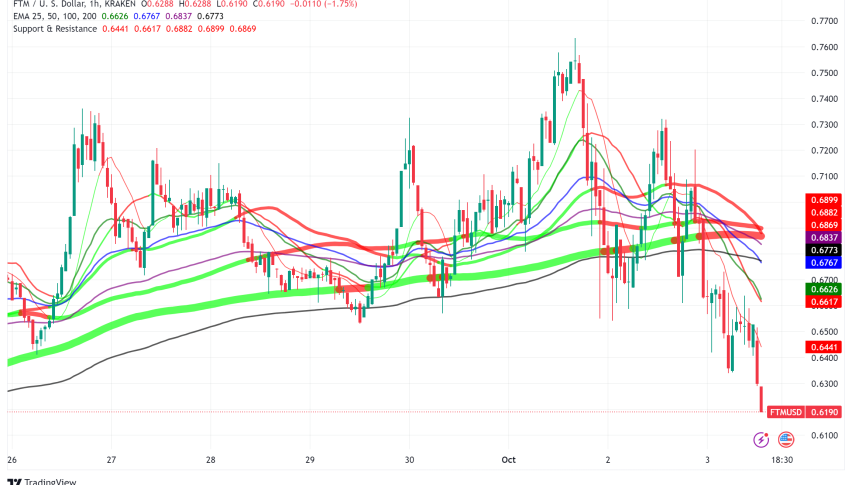
For the daily forecast, Fantom is expected to close around $0.70, with a potential range between $0.68 and $0.71. The weekly forecast suggests a closing price of approximately $0.71, with a range from $0.69 to $0.72. The RSI is currently at 38.8026, indicating a bearish trend, while the ATR at 0.0854 suggests moderate volatility. The ADX at 29.8258 shows a weakening trend strength. The MACD line is below the signal line, reinforcing a bearish outlook. The pivot point at $0.70 is crucial, as the asset is trading slightly below it, suggesting potential resistance. The economic calendar shows no significant events, leaving technical indicators as the primary drivers for price predictions.
Fundamental Overview and Analysis
Fantom’s recent price trends show a decline from its highs, reflecting broader market corrections. The asset’s value is influenced by its technological advancements and network scalability, which attract investor interest. However, market volatility and regulatory uncertainties pose challenges. Investor sentiment is cautious, with a focus on potential growth opportunities in decentralized finance (DeFi) and smart contracts. Despite current undervaluation, Fantom’s scalability and low transaction costs offer long-term growth potential. Risks include competition from other blockchain platforms and potential regulatory hurdles. Overall, Fantom is seen as a promising asset with room for growth, but investors should be mindful of market dynamics.
Outlook for Fantom
Fantom’s future outlook is shaped by its technological advancements and market trends. Historical price movements indicate a volatile market, with recent declines suggesting caution. Key factors influencing its price include economic conditions, technological developments, and regulatory changes. In the short term (1 to 6 months), Fantom may experience moderate growth, with prices stabilizing around current levels. Long-term forecasts (1 to 5 years) are optimistic, given its potential in DeFi and smart contracts. External factors like geopolitical issues or market crashes could impact prices. Overall, Fantom’s outlook is positive, but investors should remain vigilant about market conditions.
Technical Analysis
Current Price Overview: Fantom’s current price is $0.6977, slightly below the previous close of $0.6987. Over the last 24 hours, the price has shown a downward trend with moderate volatility, as indicated by the ATR. Support and Resistance Levels: Key support levels are at $0.69, $0.69, and $0.68, while resistance levels are at $0.70, $0.71, and $0.71. The pivot point is $0.70, and the asset is trading below it, suggesting resistance. Technical Indicators Analysis: The RSI at 38.8026 indicates a bearish trend. The ATR of 0.0854 suggests moderate volatility. The ADX at 29.8258 shows a weakening trend strength. The 50-day SMA and 200-day EMA are not available for crossover analysis. Market Sentiment & Outlook: Sentiment is bearish, with the price below the pivot, a declining RSI, and a weakening ADX. The lack of moving average crossover further supports this outlook.
Forecasting Returns: $1,000 Across Market Conditions
The table below outlines potential returns on a $1,000 investment in Fantom under different market scenarios. In a Bullish Breakout scenario, a 10% price increase could raise the investment to approximately $1,100. In a Sideways Range, the price might remain stable, keeping the investment around $1,000. In a Bearish Dip, a 10% decrease could lower the investment to about $900. These scenarios highlight the importance of market conditions in investment decisions. Investors should consider their risk tolerance and market outlook when deciding to invest in Fantom. Diversification and regular market analysis are recommended to mitigate risks and capitalize on potential gains.
| Scenario | Price Change | Value After 1 Month |
|---|---|---|
| Bullish Breakout | +10% to ~$0.77 | ~$1,100 |
| Sideways Range | 0% to ~$0.70 | ~$1,000 |
| Bearish Dip | -10% to ~$0.63 | ~$900 |
FAQs
What are the predicted price forecasts for the asset?
The daily forecast for Fantom suggests a closing price of around $0.70, with a range between $0.68 and $0.71. The weekly forecast indicates a closing price of approximately $0.71, with a range from $0.69 to $0.72.
What are the key support and resistance levels for the asset?
Key support levels for Fantom are at $0.69, $0.69, and $0.68. Resistance levels are at $0.70, $0.71, and $0.71. The pivot point is $0.70, and the asset is currently trading below it, indicating potential resistance.
Disclaimer
In conclusion, while the analysis provides a structured outlook on the asset’s potential price movements, it is essential to remember that financial markets are inherently unpredictable. Conducting thorough research and staying informed about market trends and economic indicators is crucial for making informed investment decisions.