Prices Forecast: Technical Analysis
For the daily forecast, Hedera Hashgraph (HBAR-USD) is expected to close around $0.19, with a potential range between $0.18 and $0.19. The weekly forecast suggests a closing price of approximately $0.19, with a range from $0.18 to $0.19. The RSI at 55.94 indicates a neutral to slightly bullish trend, while the ATR of 0.0112 suggests moderate volatility. The MACD line is above the signal line, hinting at a potential bullish momentum. However, the ADX at 19.54 shows a weak trend, indicating that significant price movements may not be imminent. The Bollinger Bands suggest the price is near the middle band, indicating a balanced market without extreme volatility. Overall, the technical indicators suggest a stable price movement with a slight bullish bias.
Fundamental Overview and Analysis
Hedera Hashgraph has shown a steady price trend recently, with minor fluctuations. The asset’s value is influenced by its unique consensus algorithm, which offers high performance and scalability. Investor sentiment remains cautiously optimistic, driven by technological advancements and partnerships. However, competition from other blockchain platforms and regulatory challenges pose risks. The current valuation appears fair, considering its technological edge and market position. Opportunities for growth include expanding its ecosystem and increasing adoption in various industries. Nonetheless, market volatility and potential regulatory changes remain significant challenges. Overall, Hedera Hashgraph is positioned for growth, but investors should remain vigilant about market dynamics.
Outlook for Hedera Hashgraph
The future outlook for Hedera Hashgraph is promising, with potential developments in its ecosystem and increased adoption. Current market trends show a stable price with moderate volatility, influenced by macroeconomic factors and technological advancements. In the short term (1 to 6 months), the price is expected to remain stable, with potential upward movement driven by positive market sentiment and technological progress. Long-term forecasts (1 to 5 years) suggest significant growth potential, supported by its unique technology and expanding use cases. However, external factors such as regulatory changes and market competition could impact its price. Investors should monitor geopolitical events and industry innovations that may affect the asset’s trajectory.
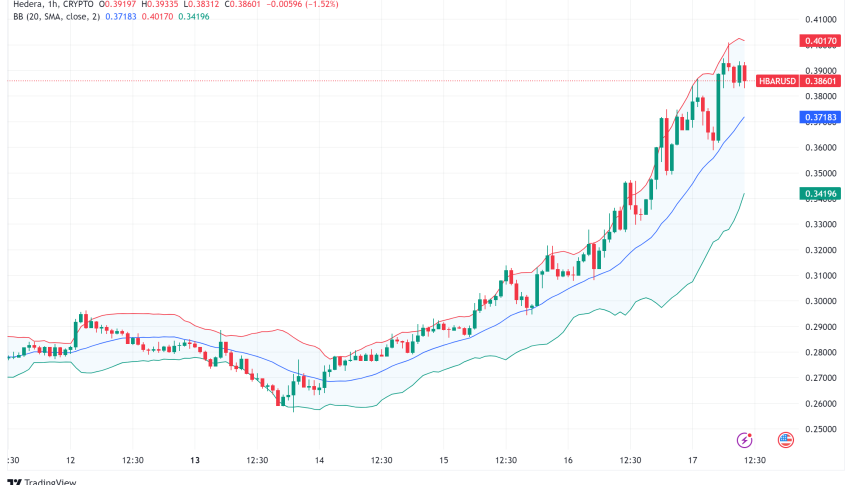
Technical Analysis
Current Price Overview: The current price of HBAR-USD is $0.1854, slightly lower than the previous close of $0.1854. Over the last 24 hours, the price has shown stability with minor fluctuations, indicating a balanced market.
Support and Resistance Levels: Key support levels are at $0.18, $0.18, and $0.18, while resistance levels are at $0.19, $0.19, and $0.19. The pivot point is at $0.19, with the asset trading slightly below it, suggesting a neutral to bearish sentiment.
Technical Indicators Analysis: The RSI at 55.94 suggests a neutral trend. The ATR of 0.0112 indicates moderate volatility. The ADX at 19.54 shows a weak trend, implying limited directional movement. The 50-day SMA and 200-day EMA do not show a crossover, indicating no significant trend change.
Market Sentiment & Outlook: Sentiment is neutral, with price action near the pivot, a neutral RSI, and a weak ADX. The lack of moving average crossover and moderate ATR-based volatility suggest a stable market without strong directional bias.
Forecasting Returns: $1,000 Across Market Conditions
The table below outlines potential returns on a $1,000 investment in HBAR-USD under different market scenarios. In a Bullish Breakout scenario, a 10% price increase could result in an estimated value of $1,100. In a Sideways Range, the price might remain stable, keeping the investment around $1,000. In a Bearish Dip, a 10% decrease could lower the investment to approximately $900. These scenarios highlight the importance of market conditions on investment outcomes. Investors should consider their risk tolerance and market outlook when deciding to invest in HBAR-USD. Diversification and regular market monitoring are recommended to manage potential risks effectively.
| Scenario | Price Change | Value After 1 Month |
|---|---|---|
| Bullish Breakout | +10% to ~$0.2039 | ~$1,100 |
| Sideways Range | 0% to ~$0.1854 | ~$1,000 |
| Bearish Dip | -10% to ~$0.1669 | ~$900 |
FAQs
What are the predicted price forecasts for the asset?
The daily forecast for Hedera Hashgraph (HBAR-USD) suggests a closing price of around $0.19, with a range between $0.18 and $0.19. The weekly forecast indicates a similar closing price of approximately $0.19, with the same range. These predictions are based on current technical indicators and market conditions.
What are the key support and resistance levels for the asset?
Key support levels for HBAR-USD are at $0.18, while resistance levels are at $0.19. The pivot point is at $0.19, with the asset trading slightly below it, indicating a neutral to bearish sentiment. These levels are crucial for traders to identify potential entry and exit points.
Disclaimer
In conclusion, while the analysis provides a structured outlook on the asset’s potential price movements, it is essential to remember that financial markets are inherently unpredictable. Conducting thorough research and staying informed about market trends and economic indicators is crucial for making informed investment decisions.