Prices Forecast: Technical Analysis
For the daily forecast, IOTA is expected to close at approximately $0.21, with a range between $0.20 and $0.22. The weekly forecast suggests a closing price of around $0.21, with a range from $0.20 to $0.22. The RSI at 63.1077 indicates a bullish momentum, suggesting that the asset is not yet overbought. The ATR of 0.0143 reflects moderate volatility, which could lead to price fluctuations within the predicted range. The ADX at 31.2531 shows a strengthening trend, supporting the bullish outlook. The MACD line is above the signal line, reinforcing the positive sentiment. These indicators collectively suggest a potential upward movement, albeit within a constrained range due to the current resistance levels.
Fundamental Overview and Analysis
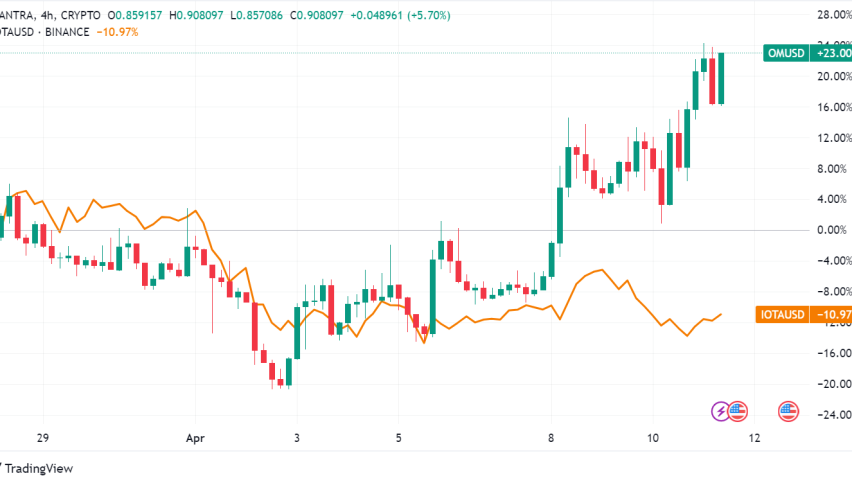
IOTA has recently shown a steady upward trend, with notable increases in trading volume, indicating growing investor interest. The asset’s value is influenced by its unique technology, which offers scalability and zero transaction fees, making it attractive for IoT applications. However, regulatory challenges and competition from other cryptocurrencies pose risks. Market participants view IOTA as a promising asset, with potential for growth as IoT adoption increases. Despite these opportunities, the asset faces challenges such as market volatility and the need for broader adoption. Currently, IOTA appears fairly valued, with its price reflecting both its technological potential and market risks.
Outlook for IOTA
The future outlook for IOTA is cautiously optimistic, with potential for growth driven by technological advancements and increased IoT integration. Historical price movements show a pattern of gradual increases, with occasional volatility spikes. Economic conditions, particularly in the tech sector, will likely influence IOTA’s price. In the short term (1 to 6 months), IOTA may experience moderate growth, with prices potentially reaching $0.23 if current trends continue. Long-term forecasts (1 to 5 years) suggest significant growth potential, contingent on technological adoption and market expansion. External factors such as regulatory changes or technological breakthroughs could significantly impact IOTA’s price trajectory.
Technical Analysis
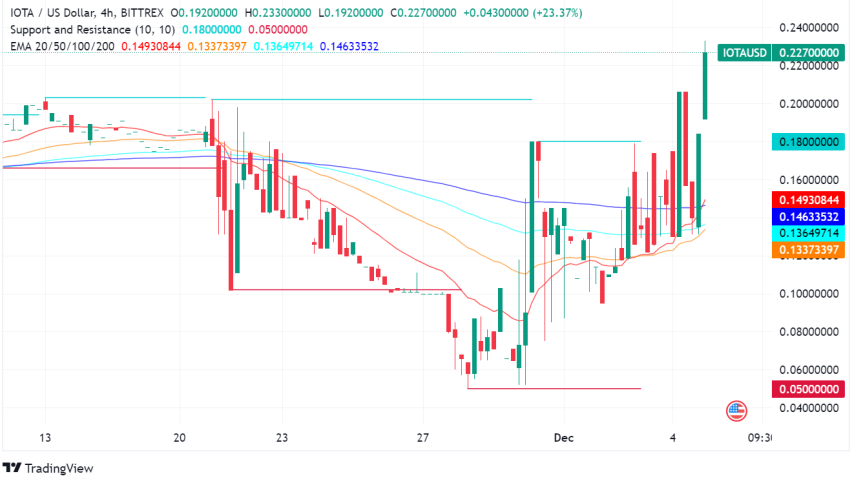
Current Price Overview: The current price of IOTA is $0.2085, slightly below the previous close of $0.21. Over the last 24 hours, the price has shown a slight downward trend with moderate volatility, as indicated by the ATR. Support and Resistance Levels: Key support levels are at $0.20, $0.21, and $0.21, while resistance levels are at $0.21, $0.21, and $0.22. The pivot point is at $0.21, with IOTA trading slightly below it, suggesting a potential for upward movement if it breaks above this level. Technical Indicators Analysis: The RSI at 63.1077 suggests a bullish trend, while the ATR indicates moderate volatility. The ADX at 31.2531 confirms a strengthening trend. The 50-day SMA and 200-day EMA do not show a crossover, indicating a stable trend. Market Sentiment & Outlook: Sentiment is currently bullish, supported by the RSI and ADX. The price action relative to the pivot and the absence of a moving average crossover suggest potential for upward movement, though volatility remains a factor.
Forecasting Returns: $1,000 Across Market Conditions
The table below outlines potential returns on a $1,000 investment in IOTA under different market scenarios. In a Bullish Breakout scenario, a 10% price increase could raise the investment value to approximately $1,100. In a Sideways Range scenario, the price might remain stable, keeping the investment around $1,000. In a Bearish Dip scenario, a 10% decrease could reduce the investment to about $900. These scenarios highlight the importance of market conditions in determining investment outcomes. Investors should consider their risk tolerance and market outlook when deciding to invest in IOTA. Diversification and regular market analysis are recommended to mitigate risks and capitalize on potential gains.
| Scenario | Price Change | Value After 1 Month |
|---|---|---|
| Bullish Breakout | +10% to ~$0.23 | ~$1,100 |
| Sideways Range | 0% to ~$0.21 | ~$1,000 |
| Bearish Dip | -10% to ~$0.19 | ~$900 |
FAQs
What are the predicted price forecasts for the asset?
The daily forecast for IOTA suggests a closing price of approximately $0.21, with a range between $0.20 and $0.22. The weekly forecast also indicates a closing price around $0.21, within the same range.
What are the key support and resistance levels for the asset?
Key support levels for IOTA are at $0.20, $0.21, and $0.21, while resistance levels are at $0.21, $0.21, and $0.22. The pivot point is at $0.21, with the asset currently trading slightly below it.
Disclaimer
In conclusion, while the analysis provides a structured outlook on the asset’s potential price movements, it is essential to remember that financial markets are inherently unpredictable. Conducting thorough research and staying informed about market trends and economic indicators is crucial for making informed investment decisions.