Prices Forecast: Technical Analysis
For the daily forecast, Pendle is expected to close around $3.20, with a potential range between $3.13 and $3.24. The weekly forecast suggests a closing price of approximately $3.24, with a range from $3.13 to $3.31. The RSI is currently at 47.4982, indicating a neutral trend, while the ATR at 0.2412 suggests moderate volatility. The ADX at 11.7178 reflects a weak trend, implying that significant price movements are unlikely in the short term. The MACD line is slightly above the signal line, hinting at a potential bullish crossover, but the histogram shows decreasing momentum. The economic calendar shows no significant changes in PMI figures, suggesting stable macroeconomic conditions. Overall, the technical indicators suggest a cautious outlook with limited upside potential.
Fundamental Overview and Analysis
Pendle has experienced a downward trend recently, with the last closing price at $3.1702. The asset’s value is influenced by market sentiment and technical indicators, with no significant macroeconomic drivers currently impacting its price. Investor sentiment appears cautious, as reflected in the RSI and ADX values. Opportunities for Pendle’s growth may arise from technological advancements and increased adoption, but competition and market volatility pose challenges. The asset’s current valuation seems fair, given the technical indicators and market conditions. However, the lack of strong directional momentum suggests that Pendle may remain range-bound in the near term. Traders should watch for any changes in market sentiment or external factors that could impact Pendle’s price.
Outlook for Pendle
Pendle’s future outlook remains uncertain, with market trends indicating a potential sideways movement. Historical price movements show a lack of strong directional trends, and the current technical indicators suggest limited volatility. Economic conditions, such as stable PMI figures, provide a neutral backdrop for Pendle’s price. In the short term (1 to 6 months), Pendle may experience minor fluctuations within the $3.13 to $3.31 range, influenced by market sentiment and technical factors. Long-term forecasts (1 to 5 years) depend on broader market dynamics and potential technological advancements. External factors, such as regulatory changes or industry innovations, could significantly impact Pendle’s price. Investors should remain vigilant and consider both technical and fundamental factors when evaluating Pendle’s potential.
Technical Analysis
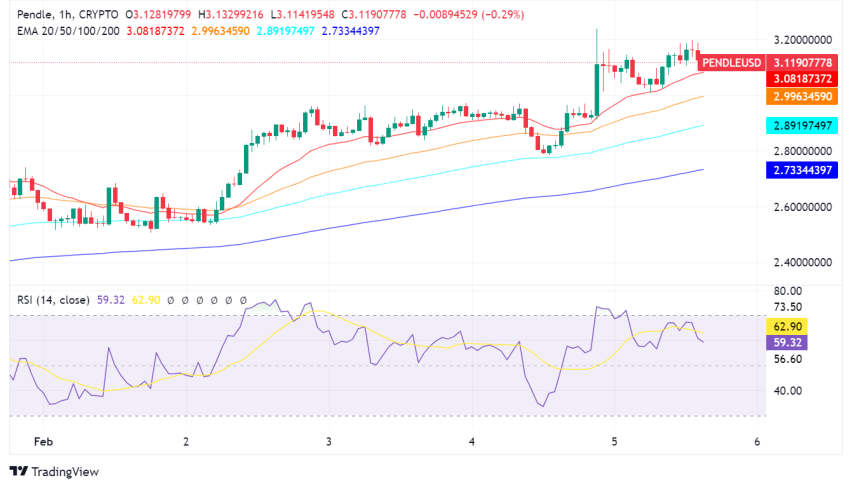
Current Price Overview: The current price of Pendle is $3.1702, slightly below the previous close of $3.2114. Over the last 24 hours, the price has shown a slight downward trend with moderate volatility, as indicated by the ATR. Support and Resistance Levels: Key support levels are at $3.13, $3.08, and $3.01, while resistance levels are at $3.24, $3.31, and $3.35. The pivot point is at $3.20, and Pendle is trading slightly below it, suggesting a neutral to bearish sentiment. Technical Indicators Analysis: The RSI at 47.4982 indicates a neutral trend, while the ATR at 0.2412 suggests moderate volatility. The ADX at 11.7178 reflects a weak trend, and the 50-day SMA is above the 200-day EMA, indicating no significant crossover. Market Sentiment & Outlook: Sentiment is currently neutral to bearish, with price action below the pivot, a neutral RSI, and weak ADX. The lack of a moving average crossover and moderate ATR-based volatility further support this outlook.
Forecasting Returns: $1,000 Across Market Conditions
The table below outlines potential returns on a $1,000 investment in Pendle under various market scenarios. In a Bullish Breakout scenario, a 10% price increase could raise the investment value to approximately $1,100. In a Sideways Range scenario, a 0% change would maintain the investment at $1,000. In a Bearish Dip scenario, a 10% decrease could reduce the investment to around $900. These scenarios highlight the importance of market conditions in determining investment outcomes. Investors should consider their risk tolerance and market outlook when deciding to invest in Pendle. Monitoring technical indicators and market sentiment can provide valuable insights into potential price movements. Diversifying investments and setting stop-loss orders can help manage risk in volatile markets.
| Scenario | Price Change | Value After 1 Month |
|---|---|---|
| Bullish Breakout | +10% to ~$3.50 | ~$1,100 |
| Sideways Range | 0% to ~$3.20 | ~$1,000 |
| Bearish Dip | -10% to ~$2.90 | ~$900 |
FAQs
What are the predicted price forecasts for the asset?
The daily forecast for Pendle suggests a closing price of around $3.20, with a range between $3.13 and $3.24. The weekly forecast indicates a closing price of approximately $3.24, with a range from $3.13 to $3.31.
What are the key support and resistance levels for the asset?
Key support levels for Pendle are at $3.13, $3.08, and $3.01, while resistance levels are at $3.24, $3.31, and $3.35. The pivot point is at $3.20, and Pendle is currently trading slightly below it.
What are the main factors influencing the asset’s price?
Pendle’s price is influenced by technical indicators such as RSI, ATR, and ADX, as well as market sentiment. Stable macroeconomic conditions, as indicated by PMI figures, also play a role in shaping the asset’s price.
What is the outlook for the asset in the next 1 to 6 months?
In the short term, Pendle is expected to experience minor fluctuations within the $3.13 to $3.31 range. The outlook is influenced by market sentiment, technical factors, and stable economic conditions, suggesting limited volatility.
Disclaimer
In conclusion, while the analysis provides a structured outlook on the asset’s potential price movements, it is essential to remember that financial markets are inherently unpredictable. Conducting thorough research and staying informed about market trends and economic indicators is crucial for making informed investment decisions.