Prices Forecast: Technical Analysis
For the daily forecast, Tezos (XTZ-USD) is expected to close around $0.56, with a potential range between $0.54 and $0.57. The weekly forecast suggests a closing price of approximately $0.55, with a range from $0.54 to $0.56. The RSI at 47.34 indicates a neutral trend, suggesting neither strong buying nor selling pressure. The ATR of 0.0295 points to moderate volatility, while the ADX at 35.93 suggests a weak trend. The MACD line is below the signal line, indicating bearish momentum. These indicators, combined with the current economic calendar data, suggest a cautious outlook for Tezos in the short term.
Fundamental Overview and Analysis
Tezos has experienced a downward trend recently, with its price closing at $0.5553. The asset’s value is influenced by factors such as technological advancements in blockchain, regulatory changes, and investor sentiment. The current market sentiment appears cautious, with moderate trading volumes and a neutral RSI. Opportunities for Tezos include its scalability and potential for smart contract applications. However, challenges such as competition from other blockchain platforms and regulatory hurdles remain. The asset’s current valuation seems fair, given the technical indicators and market conditions. Investors should consider these factors when evaluating Tezos’ potential for growth.
Outlook for Tezos
Tezos’ future outlook is shaped by market trends, including historical price movements and volatility. The asset’s price is likely to be influenced by economic conditions, regulatory changes, and technological advancements. In the short term (1 to 6 months), Tezos may experience slight fluctuations, with a potential range between $0.54 and $0.57. Long-term forecasts (1 to 5 years) depend on the asset’s ability to innovate and adapt to market demands. External factors such as geopolitical issues or industry innovations could significantly impact Tezos’ price. Investors should remain vigilant and consider both short-term and long-term factors when making investment decisions.
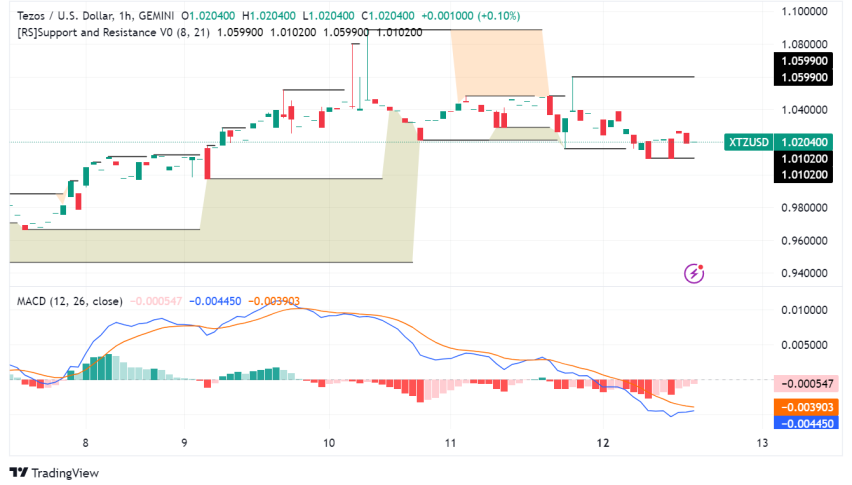
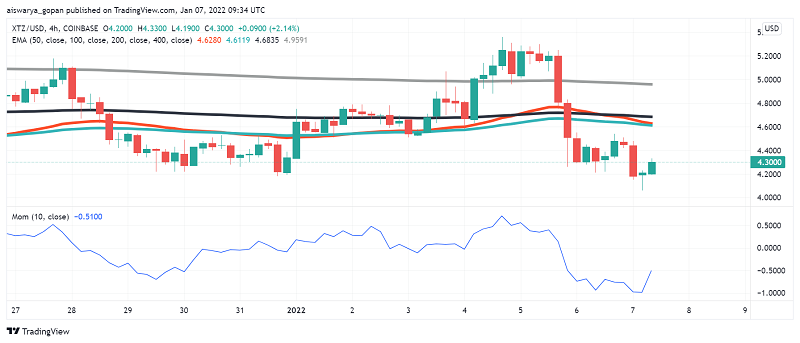
Technical Analysis
Current Price Overview: The current price of Tezos is $0.5553, slightly below the previous close of $0.5553. Over the last 24 hours, the price has shown limited movement, indicating low volatility. Support and Resistance Levels: Key support levels are at $0.54, $0.54, and $0.55, while resistance levels are at $0.56, $0.56, and $0.57. The pivot point is at $0.55, with Tezos trading slightly above it, suggesting a neutral to slightly bullish sentiment. Technical Indicators Analysis: The RSI at 47.34 suggests a neutral trend. The ATR of 0.0295 indicates moderate volatility. The ADX at 35.93 shows a weak trend. The 50-day SMA and 200-day EMA do not indicate a crossover, suggesting no significant trend change. Market Sentiment & Outlook: Sentiment is neutral, with price action near the pivot, a neutral RSI, and moderate volatility. Investors should watch for any changes in these indicators for future price movements.
Forecasting Returns: $1,000 Across Market Conditions
The table below outlines potential returns on a $1,000 investment in Tezos under different market scenarios. In a Bullish Breakout scenario, a 10% price increase could raise the investment to approximately $1,100. In a Sideways Range, the price might remain stable, keeping the investment around $1,000. In a Bearish Dip, a 10% decrease could lower the investment to about $900. These scenarios highlight the importance of market conditions in investment outcomes. Investors should consider their risk tolerance and market outlook when deciding to invest in Tezos.
| Scenario | Price Change | Value After 1 Month |
|---|---|---|
| Bullish Breakout | +10% to ~$0.61 | ~$1,100 |
| Sideways Range | 0% to ~$0.56 | ~$1,000 |
| Bearish Dip | -10% to ~$0.50 | ~$900 |
FAQs
What are the predicted price forecasts for the asset?
The daily forecast for Tezos suggests a closing price of around $0.56, with a range between $0.54 and $0.57. The weekly forecast indicates a closing price of approximately $0.55, with a range from $0.54 to $0.56.
What are the key support and resistance levels for the asset?
Key support levels for Tezos are at $0.54, $0.54, and $0.55, while resistance levels are at $0.56, $0.56, and $0.57. The pivot point is at $0.55, with Tezos trading slightly above it.
Disclaimer
In conclusion, while the analysis provides a structured outlook on the asset’s potential price movements, it is essential to remember that financial markets are inherently unpredictable. Conducting thorough research and staying informed about market trends and economic indicators is crucial for making informed investment decisions.