Prices Forecast: Technical Analysis
For the daily forecast, The Sandbox is expected to close around $0.27, with a potential range between $0.26 and $0.28. The weekly forecast suggests a closing price of approximately $0.28, with a range from $0.27 to $0.29. The RSI at 44.6468 indicates a neutral to slightly bearish sentiment, suggesting limited upward momentum. The ATR of 0.0158 points to moderate volatility, while the ADX at 16.4757 reflects a weak trend, implying potential sideways movement. The MACD histogram shows a slight bearish divergence, reinforcing the possibility of a consolidation phase. The economic calendar shows no significant events that could impact The Sandbox’s price in the short term. Overall, the technical indicators suggest a cautious outlook with potential for minor fluctuations within the specified range.
Fundamental Overview and Analysis
The Sandbox has experienced a gradual decline in price over recent months, reflecting broader market trends and investor sentiment. Factors such as the overall crypto market volatility and regulatory uncertainties have influenced its value. Despite these challenges, The Sandbox’s innovative platform and growing user base present opportunities for future growth. The asset’s scalability and potential for expansion into new markets are key drivers for its long-term success. However, competition from other metaverse projects and potential regulatory hurdles pose risks. Currently, The Sandbox appears to be fairly priced, with its valuation reflecting both its potential and the inherent risks. Investors remain cautiously optimistic, balancing the asset’s innovative potential against market volatility.
Outlook for The Sandbox
The future outlook for The Sandbox is cautiously optimistic, with potential for growth driven by technological advancements and increased adoption of metaverse platforms. Historical price movements indicate a pattern of volatility, with significant fluctuations influenced by broader market trends. In the short term, economic conditions and regulatory developments will likely play a crucial role in shaping its price. Over the next 1 to 6 months, The Sandbox may experience moderate growth, with prices potentially stabilizing as market conditions improve. Long-term forecasts suggest potential for significant appreciation, contingent on successful platform development and market expansion. External factors such as geopolitical issues or industry innovations could significantly impact its price trajectory. Overall, The Sandbox’s outlook is positive, with opportunities for growth balanced by market risks.
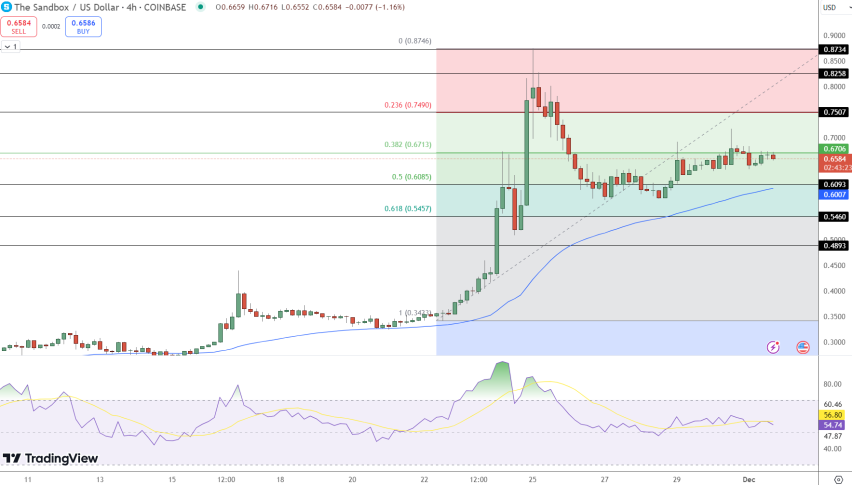
Technical Analysis
Current Price Overview: The current price of The Sandbox is $0.2726, slightly above the previous close of $0.2726. Over the last 24 hours, the price has shown limited movement, indicating a consolidation phase with moderate volatility. Support and Resistance Levels: Key support levels are at $0.27, $0.27, and $0.26, while resistance levels are at $0.28, $0.28, and $0.29. The pivot point is at $0.27, with the asset trading slightly above it, suggesting a neutral to slightly bullish sentiment. Technical Indicators Analysis: The RSI at 44.6468 suggests a neutral trend, while the ATR of 0.0158 indicates moderate volatility. The ADX at 16.4757 reflects a weak trend, implying potential sideways movement. The 50-day SMA and 200-day EMA show no significant crossover, indicating a lack of strong directional momentum. Market Sentiment & Outlook: Current sentiment is neutral, with price action hovering around the pivot. The RSI and ADX suggest limited trend strength, while the absence of a moving average crossover indicates a lack of clear direction. Volatility remains moderate, suggesting potential for minor price fluctuations.
Forecasting Returns: $1,000 Across Market Conditions
The table below outlines potential returns on a $1,000 investment in The Sandbox under various market scenarios. In a Bullish Breakout scenario, a 10% price increase could raise the investment value to approximately $1,100. In a Sideways Range scenario, with a 0% change, the investment remains at $1,000. In a Bearish Dip scenario, a 10% decrease could reduce the investment to around $900. These scenarios highlight the importance of market conditions in determining investment outcomes. Investors should consider their risk tolerance and market outlook when deciding to invest. Practical steps include monitoring market trends, setting stop-loss orders, and diversifying portfolios to mitigate risks. Overall, The Sandbox presents opportunities for growth, but investors should remain cautious given the current market volatility.
| Scenario | Price Change | Value After 1 Month |
|---|---|---|
| Bullish Breakout | +10% to ~$0.30 | ~$1,100 |
| Sideways Range | 0% to ~$0.27 | ~$1,000 |
| Bearish Dip | -10% to ~$0.24 | ~$900 |
FAQs
What are the predicted price forecasts for the asset?
The daily forecast for The Sandbox suggests a closing price of around $0.27, with a range between $0.26 and $0.28. The weekly forecast anticipates a closing price of approximately $0.28, with a range from $0.27 to $0.29. These predictions are based on current technical indicators and market conditions.
What are the key support and resistance levels for the asset?
The key support levels for The Sandbox are at $0.27, $0.27, and $0.26. Resistance levels are identified at $0.28, $0.28, and $0.29. The pivot point is at $0.27, with the asset currently trading slightly above it, indicating a neutral to slightly bullish sentiment.
Disclaimer
In conclusion, while the analysis provides a structured outlook on the asset’s potential price movements, it is essential to remember that financial markets are inherently unpredictable. Conducting thorough research and staying informed about market trends and economic indicators is crucial for making informed investment decisions.