Prices Forecast: Technical Analysis
For the daily forecast, yearn.finance is expected to close around $5,300, with a potential range between $5,100 and $5,500. The weekly forecast suggests a closing price near $5,400, with a range from $5,200 to $5,600. The RSI is currently at 51.7038, indicating a neutral trend, while the ATR at 275.3139 suggests moderate volatility. The ADX at 29.0949 shows a weak trend, implying that significant price movements are unlikely in the short term. The MACD histogram is negative, indicating bearish momentum, but the price is trading above the pivot point of 5270.06, suggesting potential upward movement. The economic calendar shows no significant events, leaving technical indicators as the primary drivers for price predictions.
Fundamental Overview and Analysis
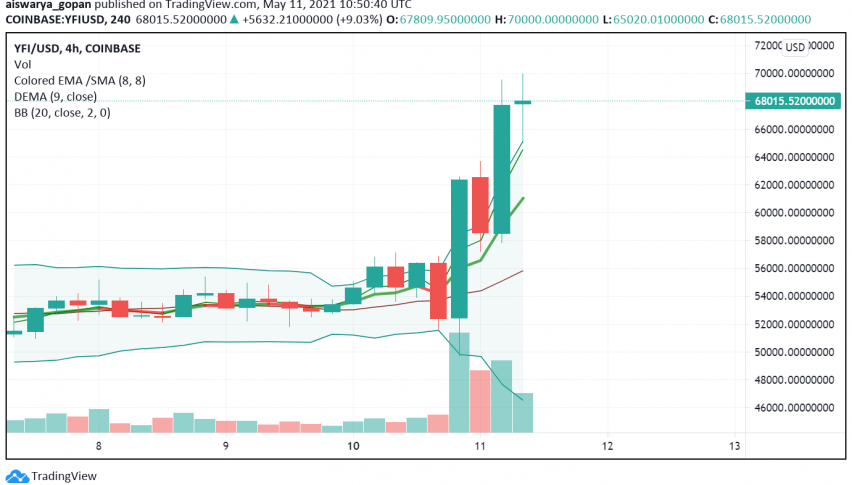
Yearn.finance has experienced fluctuating prices recently, with notable volatility driven by market sentiment and technical factors. The asset’s value is influenced by the broader cryptocurrency market trends, including investor interest in decentralized finance (DeFi) and regulatory developments. Market participants view yearn.finance as a high-risk, high-reward asset, with potential for significant gains if DeFi continues to grow. However, risks include regulatory scrutiny and competition from other DeFi platforms. Currently, the asset appears fairly priced, given its recent performance and market conditions. Investors should consider the potential for growth alongside the inherent risks of the volatile crypto market.
Outlook for yearn.finance
The future outlook for yearn.finance is cautiously optimistic, with potential for growth driven by the expanding DeFi sector. Historical price movements show a pattern of volatility, with significant swings in both directions. Key factors influencing future prices include economic conditions, regulatory changes, and technological advancements in the DeFi space. In the short term (1 to 6 months), prices may stabilize around current levels, with potential for upward movement if market sentiment improves. Long-term forecasts (1 to 5 years) suggest growth potential, but investors should be wary of external factors like geopolitical issues or market crashes that could impact prices. Overall, yearn.finance remains a speculative investment with both opportunities and risks.
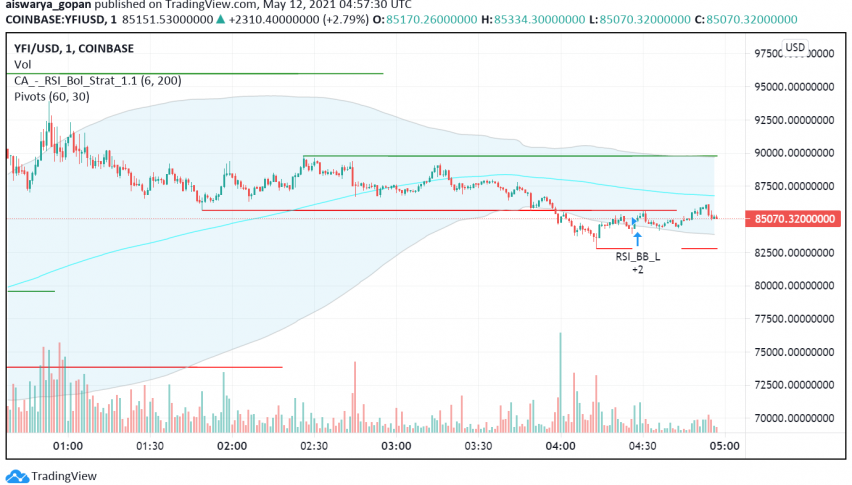
Technical Analysis
Current Price Overview: The current price of yearn.finance is $5,289.56, slightly below the previous close of $5,289.56. Over the last 24 hours, the price has shown moderate volatility, with no significant patterns emerging. Support and Resistance Levels: Key support levels are at $5,216.89, $5,144.23, and $5,091.06, while resistance levels are at $5,342.72, $5,395.88, and $5,468.55. The asset is trading just below the pivot point of $5,270.06, indicating potential resistance. Technical Indicators Analysis: The RSI at 51.7038 suggests a neutral trend, while the ATR at 275.3139 indicates moderate volatility. The ADX at 29.0949 shows a weak trend, and the 50-day SMA is above the 200-day EMA, suggesting a potential bullish crossover. Market Sentiment & Outlook: Sentiment is currently neutral, with price action near the pivot, a neutral RSI, and weak ADX. The moving average crossover suggests potential bullish momentum, but ATR-based volatility remains moderate.
Forecasting Returns: $1,000 Across Market Conditions
Investing $1,000 in yearn.finance presents various scenarios based on market conditions. In a Bullish Breakout scenario, a 10% price increase could raise the investment to approximately $1,100. In a Sideways Range scenario, a 0% change would maintain the investment at $1,000. In a Bearish Dip scenario, a 10% decrease could reduce the investment to around $900. These scenarios highlight the asset’s volatility and the importance of timing in investment decisions. Investors should consider their risk tolerance and market conditions before investing. Diversification and a long-term perspective may help mitigate risks associated with the volatile crypto market.
| Scenario | Price Change | Value After 1 Month |
|---|---|---|
| Bullish Breakout | +10% to ~$5,818 | ~$1,100 |
| Sideways Range | 0% to ~$5,289 | ~$1,000 |
| Bearish Dip | -10% to ~$4,760 | ~$900 |
FAQs
What are the predicted price forecasts for the asset?
The daily forecast for yearn.finance suggests a closing price around $5,300, with a range between $5,100 and $5,500. The weekly forecast indicates a closing price near $5,400, with a range from $5,200 to $5,600.
What are the key support and resistance levels for the asset?
Key support levels for yearn.finance are at $5,216.89, $5,144.23, and $5,091.06. Resistance levels are at $5,342.72, $5,395.88, and $5,468.55. The pivot point is at $5,270.06.
What are the main factors influencing the asset’s price?
Yearn.finance’s price is influenced by market sentiment, technical indicators, and broader cryptocurrency trends. Economic conditions, regulatory changes, and technological advancements in DeFi also play significant roles.
What is the outlook for the asset in the next 1 to 6 months?
In the short term, yearn.finance’s price may stabilize around current levels, with potential for upward movement if market sentiment improves. However, external factors like regulatory changes could impact prices.
Disclaimer
In conclusion, while the analysis provides a structured outlook on the asset’s potential price movements, it is essential to remember that financial markets are inherently unpredictable. Conducting thorough research and staying informed about market trends and economic indicators is crucial for making informed investment decisions.