Prices Forecast: Technical Analysis
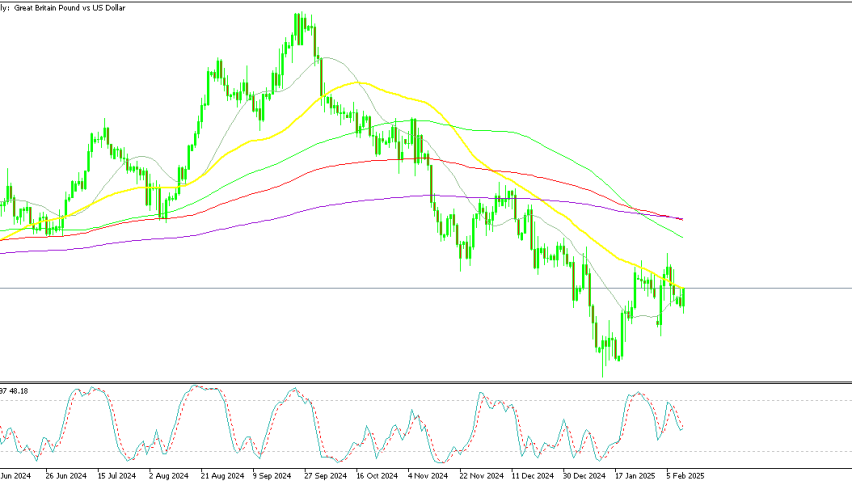
For the daily forecast, the GBP/USD is expected to close around 1.3300, with a potential range between 1.3200 and 1.3400. The weekly forecast suggests a closing price of approximately 1.3350, with a range from 1.3250 to 1.3450. The RSI is currently at 58.962, indicating a neutral to slightly bullish trend, while the ATR at 0.0125 suggests moderate volatility. The ADX at 30.8254 reflects a moderately strong trend. The MACD histogram shows a positive value, supporting a bullish outlook. The economic calendar shows no significant data releases, which might keep the price movements within the technical levels. Overall, the technical indicators suggest a cautious bullish sentiment for the GBP/USD in the short term.
Fundamental Overview and Analysis
Recently, GBP/USD has shown a steady upward trend, reflecting a recovery from previous lows. The pair’s value is influenced by macroeconomic factors such as interest rate expectations and economic data from the UK and US. Investor sentiment appears cautiously optimistic, with traders eyeing potential rate hikes. Opportunities for growth include the UK’s economic resilience and potential trade deals. However, risks such as Brexit-related uncertainties and global economic slowdowns pose challenges. Currently, the asset seems fairly priced, with room for growth if economic conditions improve. Market participants are closely monitoring central bank policies and geopolitical developments for further cues.
Outlook for GBP/USD
The future outlook for GBP/USD remains cautiously optimistic, with potential for further gains if economic conditions remain supportive. Historical price movements show a recovery trend, with moderate volatility expected to continue. Key factors influencing the price include economic data releases, central bank policies, and geopolitical events. In the short term (1 to 6 months), the pair could see gradual appreciation, potentially reaching 1.3500 if bullish conditions persist. Long-term forecasts (1 to 5 years) depend on economic growth and policy decisions, with potential risks from global economic uncertainties. External factors such as trade negotiations and political developments could significantly impact the pair’s trajectory.
Technical Analysis
Current Price Overview: The current price of GBP/USD is 1.3297, slightly higher than the previous close of 1.3297. Over the last 24 hours, the price has shown a slight upward trend with moderate volatility. Support and Resistance Levels: Key support levels are at 1.3200, 1.3100, and 1.3000, while resistance levels are at 1.3400, 1.3500, and 1.3600. The pivot point is at 1.3300, with the asset trading just below it, indicating a potential for upward movement. Technical Indicators Analysis: The RSI at 58.962 suggests a neutral to slightly bullish trend. The ATR at 0.0125 indicates moderate volatility. The ADX at 30.8254 shows a moderately strong trend. The 50-day SMA is above the 200-day EMA, indicating a bullish crossover. Market Sentiment & Outlook: Sentiment is cautiously bullish, with price action near the pivot, a neutral RSI, and a bullish moving average crossover. Moderate volatility supports potential upward movement.
Forecasting Returns: $1,000 Across Market Conditions
Investing $1,000 in GBP/USD could yield different outcomes based on market conditions. In a Bullish Breakout scenario, a 5% increase could raise the investment to approximately $1,050. In a Sideways Range, the investment might remain around $1,000 with minimal change. In a Bearish Dip, a 5% decrease could reduce the investment to about $950. These scenarios highlight the importance of market conditions on investment returns. Investors should consider current trends and technical indicators before making decisions. Diversifying investments and setting stop-loss orders can help manage risks effectively.
| Scenario | Price Change | Value After 1 Month |
|---|---|---|
| Bullish Breakout | +5% to ~$1,050 | ~$1,050 |
| Sideways Range | 0% to ~$1,000 | ~$1,000 |
| Bearish Dip | -5% to ~$950 | ~$950 |
FAQs
What are the predicted price forecasts for the asset?
The daily forecast for GBP/USD suggests a closing price around 1.3300, with a range between 1.3200 and 1.3400. The weekly forecast indicates a closing price of approximately 1.3350, with a range from 1.3250 to 1.3450.
What are the key support and resistance levels for the asset?
Key support levels for GBP/USD are at 1.3200, 1.3100, and 1.3000. Resistance levels are at 1.3400, 1.3500, and 1.3600. The pivot point is at 1.3300, with the asset trading just below it.
Disclaimer
In conclusion, while the analysis provides a structured outlook on the asset’s potential price movements, it is essential to remember that financial markets are inherently unpredictable. Conducting thorough research and staying informed about market trends and economic indicators is crucial for making informed investment decisions.