Prices Forecast: Technical Analysis
For the daily forecast, USD/JPY is expected to close around 144.23, with a potential range between 143.04 and 145.43. The weekly forecast suggests a closing price near 144.67, with a range from 143.48 to 145.87. The RSI at 46.126 indicates a neutral trend, suggesting neither strong buying nor selling pressure. The ATR of 1.9653 points to moderate volatility, which could lead to price fluctuations within the predicted range. The ADX at 21.4254 suggests a weak trend, indicating that significant directional moves are unlikely in the short term. The MACD line is below the signal line, hinting at potential bearish momentum, but the histogram shows a decreasing negative value, suggesting a possible reversal. The economic calendar shows no significant data releases, which might keep the pair within the technical levels.
Fundamental Overview and Analysis
USD/JPY has recently shown a downward trend, with the last closing price at 143.916. The pair’s movement is influenced by the relative strength of the US dollar and Japanese yen, driven by economic indicators such as PMI data. The US ISM Services PMI forecast at 50.3 suggests a slight contraction, which could weigh on the dollar. Investor sentiment appears cautious, with traders closely monitoring economic data for signs of economic health. Opportunities for growth in USD/JPY may arise from potential US economic recovery, but risks include geopolitical tensions and changes in monetary policy. The pair seems fairly priced given current economic conditions, but any unexpected economic data could shift this balance.
Outlook for USD/JPY
The future outlook for USD/JPY suggests a stable to slightly bearish trend in the short term, with potential for minor fluctuations. Historical price movements show a recent decline, with volatility remaining moderate. Key factors influencing the pair include US economic data, particularly PMI figures, and any changes in monetary policy by the Federal Reserve or Bank of Japan. In the short term (1 to 6 months), USD/JPY might hover around the current levels, with potential dips if US economic data disappoints. Long-term forecasts (1 to 5 years) depend on broader economic recovery and geopolitical stability. External factors such as trade tensions or shifts in global economic policies could significantly impact the pair’s trajectory.
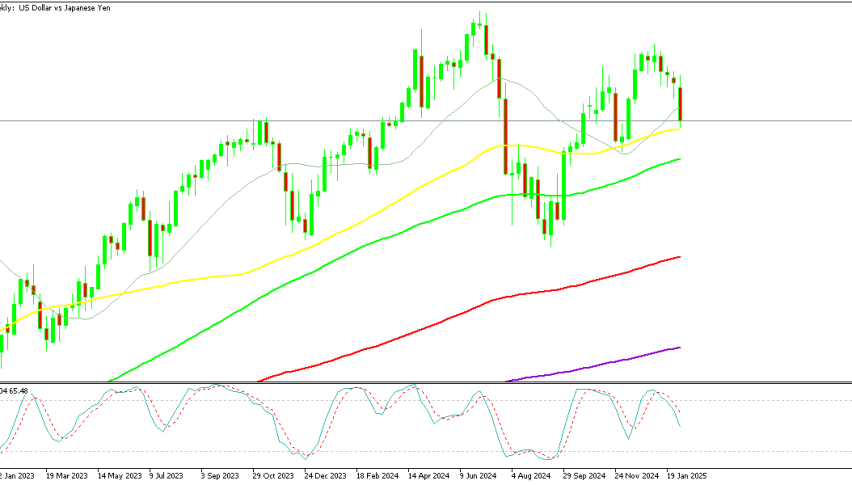
Technical Analysis
Current Price Overview: The current price of USD/JPY is 143.916, slightly below the previous close of 144.23. Over the last 24 hours, the price has shown a slight downward trend with moderate volatility, as indicated by the ATR. Support and Resistance Levels: Key support levels are at 143.48, 143.04, and 142.28, while resistance levels are at 144.67, 145.43, and 145.87. The pivot point is at 144.23, and the asset is trading below it, suggesting potential bearish sentiment. Technical Indicators Analysis: The RSI at 46.126 indicates a neutral trend, while the ATR of 1.9653 suggests moderate volatility. The ADX at 21.4254 shows a weak trend, and the 50-day SMA is below the 200-day EMA, indicating potential bearish momentum. Market Sentiment & Outlook: Sentiment appears bearish, with the price below the pivot and the RSI and ADX suggesting weak momentum. The moving average crossover supports this view, while ATR-based volatility indicates potential for price swings.
Forecasting Returns: $1,000 Across Market Conditions
The table below outlines potential returns on a $1,000 investment in USD/JPY under different market scenarios. In a Bullish Breakout scenario, a 5% increase could raise the investment to approximately $1,050. In a Sideways Range, the investment might remain around $1,000, reflecting minimal price change. In a Bearish Dip, a 5% decrease could reduce the investment to about $950. These scenarios highlight the importance of understanding market conditions and adjusting strategies accordingly. Investors should consider their risk tolerance and market outlook when deciding to invest in USD/JPY. Diversification and staying informed about economic indicators can help mitigate risks and optimize returns.
| Scenario | Price Change | Value After 1 Month |
|---|---|---|
| Bullish Breakout | +5% to ~$1,050 | ~$1,050 |
| Sideways Range | 0% to ~$1,000 | ~$1,000 |
| Bearish Dip | -5% to ~$950 | ~$950 |
FAQs
What are the predicted price forecasts for the asset?
The daily forecast for USD/JPY suggests a closing price around 144.23, with a range between 143.04 and 145.43. The weekly forecast indicates a closing price near 144.67, with a range from 143.48 to 145.87.
What are the key support and resistance levels for the asset?
Key support levels for USD/JPY are at 143.48, 143.04, and 142.28. Resistance levels are at 144.67, 145.43, and 145.87. The pivot point is at 144.23, and the asset is currently trading below it.
Disclaimer
In conclusion, while the analysis provides a structured outlook on the asset’s potential price movements, it is essential to remember that financial markets are inherently unpredictable. Conducting thorough research and staying informed about market trends and economic indicators is crucial for making informed investment decisions.