Prices Forecast: Technical Analysis
For the daily forecast, TRON is expected to close at approximately $0.25, with a potential range between $0.24 and $0.26. The weekly forecast suggests a closing price of around $0.25, with a range from $0.24 to $0.26. The RSI is currently at 55.9966, indicating a neutral to slightly bullish sentiment. The ATR at 0.0061 suggests moderate volatility, while the ADX at 18.08 indicates a weak trend. The MACD line is above the signal line, suggesting a potential bullish crossover. However, the price is hovering around the pivot point of $0.25, indicating indecision in the market. The technical indicators suggest a cautious approach, as the market could swing either way depending on upcoming economic data and market sentiment.
Fundamental Overview and Analysis
TRON has experienced a relatively stable price trend recently, with minor fluctuations around the $0.25 mark. The asset’s value is influenced by its technological advancements and the broader adoption of blockchain technology. Investor sentiment appears cautiously optimistic, with a focus on TRON’s scalability and potential for expansion. However, the asset faces challenges such as regulatory scrutiny and competition from other blockchain platforms. Currently, TRON seems fairly priced, with its valuation reflecting both its potential and the risks involved. The market is watching for any regulatory changes or technological breakthroughs that could impact TRON’s future growth.
Outlook for TRON
The future outlook for TRON is cautiously optimistic, with potential developments in blockchain technology and increased adoption driving its growth. Historical price movements show a stable trend, but volatility remains a concern. Economic conditions, regulatory changes, and technological advancements are likely to influence TRON’s price in the near future. In the short term (1 to 6 months), TRON’s price could see moderate growth, potentially reaching $0.26 if positive market sentiment prevails. Long-term forecasts (1 to 5 years) suggest potential growth, but risks such as market competition and regulatory hurdles could impact its trajectory. External factors like geopolitical issues or market crashes could also significantly affect TRON’s price.
Technical Analysis
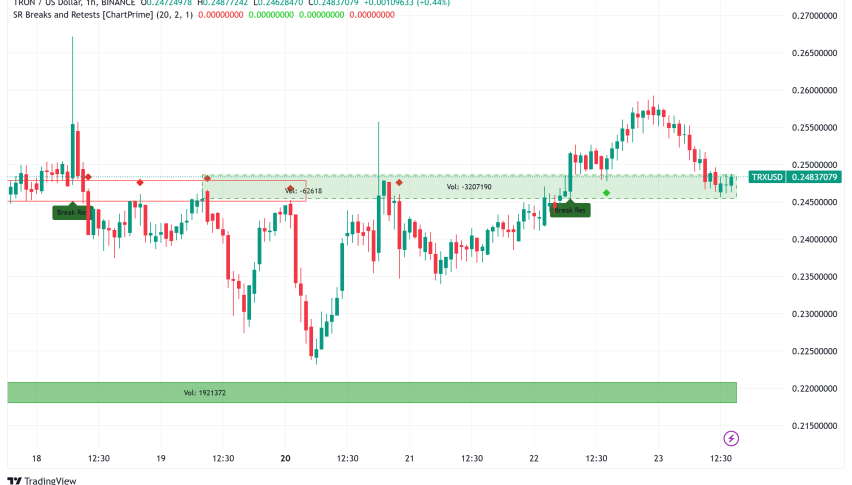
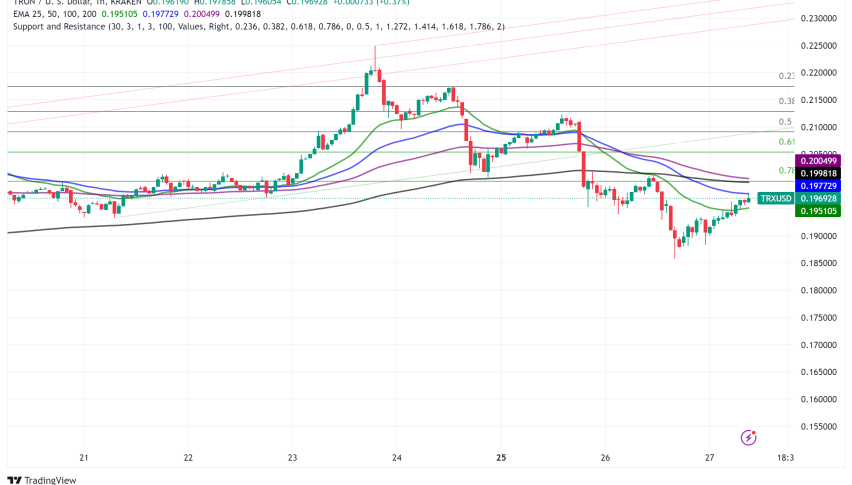
Current Price Overview: The current price of TRON is $0.2499, slightly below the previous close of $0.25. Over the last 24 hours, the price has shown minor fluctuations, indicating a stable yet cautious market sentiment. Support and Resistance Levels: Key support levels are at $0.24, $0.25, and $0.25, while resistance levels are at $0.25, $0.25, and $0.26. The asset is trading around the pivot point of $0.25, suggesting a neutral market stance. Technical Indicators Analysis: The RSI at 55.9966 suggests a neutral to slightly bullish trend. The ATR at 0.0061 indicates moderate volatility, while the ADX at 18.08 shows a weak trend. The 50-day SMA and 200-day EMA do not show a significant crossover, indicating a lack of strong directional momentum. Market Sentiment & Outlook: Sentiment is currently neutral, with price action around the pivot point and mixed signals from the RSI and ADX. The lack of a moving average crossover and moderate ATR-based volatility suggest a cautious market outlook.
Forecasting Returns: $1,000 Across Market Conditions
The table below outlines potential returns on a $1,000 investment in TRON under different market scenarios. In a Bullish Breakout scenario, a 10% price increase could raise the investment to approximately $1,100. In a Sideways Range scenario, the price might remain stable, keeping the investment around $1,000. In a Bearish Dip scenario, a 10% decrease could lower the investment to about $900. These scenarios highlight the importance of market conditions in determining investment outcomes. Investors should consider their risk tolerance and market outlook when deciding to invest in TRON. Diversification and staying informed about market trends can help mitigate risks and optimize returns.
| Scenario | Price Change | Value After 1 Month |
|---|---|---|
| Bullish Breakout | +10% to ~$0.275 | ~$1,100 |
| Sideways Range | 0% to ~$0.25 | ~$1,000 |
| Bearish Dip | -10% to ~$0.225 | ~$900 |
FAQs
What are the predicted price forecasts for the asset?
The daily forecast for TRON suggests a closing price of approximately $0.25, with a range between $0.24 and $0.26. The weekly forecast also indicates a closing price around $0.25, with the same range. These predictions are based on current technical indicators and market sentiment.
What are the key support and resistance levels for the asset?
Key support levels for TRON are at $0.24, $0.25, and $0.25, while resistance levels are at $0.25, $0.25, and $0.26. The asset is currently trading around the pivot point of $0.25, indicating a neutral market stance.
What are the main factors influencing the asset’s price?
TRON’s price is influenced by technological advancements, regulatory changes, and market sentiment. The asset’s scalability and potential for expansion also play a role, along with competition from other blockchain platforms and broader economic conditions.
What is the outlook for the asset in the next 1 to 6 months?
In the short term, TRON’s price could see moderate growth, potentially reaching $0.26 if positive market sentiment prevails. However, economic conditions, regulatory changes, and technological advancements will likely influence its price trajectory.
Disclaimer
In conclusion, while the analysis provides a structured outlook on the asset’s potential price movements, it is essential to remember that financial markets are inherently unpredictable. Conducting thorough research and staying informed about market trends and economic indicators is crucial for making informed investment decisions.