S&P 500 Price Forecast: SPX Under Pressure amid Fed Rates and Geopolitical Tensions; Eyes on US CPI Figures
Market optimism persists as evidenced by the S&P 500 index's robust rally, recently surpassing the 5,000 mark for a historic high.

Market optimism persists as evidenced by the S&P 500 index’s robust rally, recently surpassing the 5,000 mark for a historic high. This surge, reflecting a more than 5% increase since the year’s start, is supported by the index’s fifth consecutive week of gains, with the S&P 500 and Nasdaq Composite rising by 1.4% and 2.3%, respectively, last week. The Dow Jones Industrial Average also saw modest gains. This upward momentum is attributed to positive U.S. economic indicators and the Federal Reserve’s firm approach on interest rates.
The Federal Reserve’s interest rate policy remains a critical watchpoint for investors, directly impacting market dynamics and investment strategies. Despite inflation concerns, the Fed is unlikely to lower interest rates in the upcoming March meeting. Dallas Fed President Lorie K. Logan highlighted the absence of a current necessity for rate reductions, pointing to strides made in inflation control. Market responses to Fed actions are crucial, with a 60% probability of a rate decrease at the May meeting indicating prevailing market uncertainties.
Concurrently, geopolitical tensions, notably the Israel-Hamas conflict, introduce a layer of complexity to market trajectories, potentially influencing the S&P 500’s future. Recent escalations, including airstrikes in Gaza and missile launches by Yemen’s Houthi rebels, amplify investor apprehension, underscoring the intricate relationship between geopolitical events and market performance.
S&P500 (SPX) Price Forecast: Technical Outlook
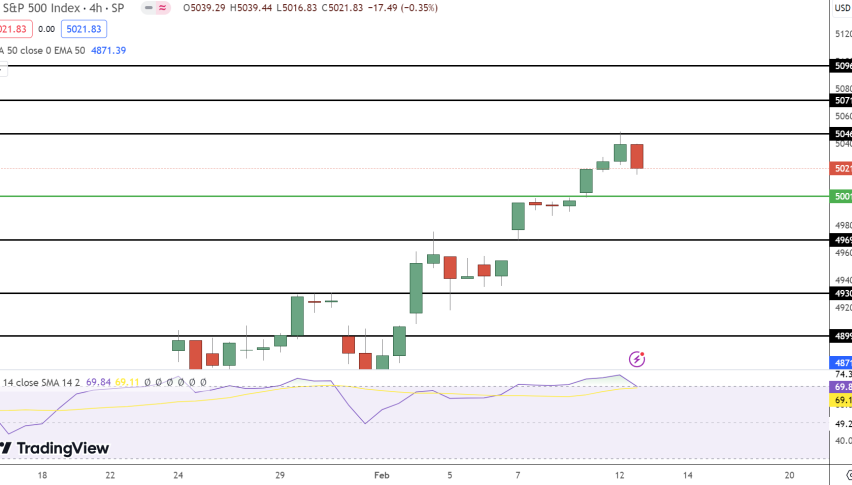
On February 13, the S&P 500 Index slightly retreated, closing at $5021.83, marking a minor decrease of 0.10%. This performance situates the index just below its pivot point of $5044, suggesting a cautious stance among investors. Key resistance levels are set at $5070, $5095, and $5123, delineating potential hurdles for upward movement. Support levels, on the other hand, are established at $5004, $4974, and $4941, crucial for preventing further declines.
The Relative Strength Index (RSI) stands at 70, indicating a potential overbought condition that could precede a pullback. The 50-day and 200-day Exponential Moving Averages, at $4950 and $4783, respectively, underscore a longer-term bullish trend, yet the immediate outlook appears bearish below the $5044 mark.
- Check out our free forex signals
- Follow the top economic events on FX Leaders economic calendar
- Trade better, discover more Forex Trading Strategies
- Open a FREE Trading Account
- Read our latest reviews on: Avatrade, Exness, HFM and XM
Related Articles

Sidebar rates
Related Posts
Add 3440


