S&P 500 and Stock markets Retreat on US Election Risks
Despite declining Treasury yields, S&P 500 and U.S. stock futures failed to hold gains as large-cap tech stocks dragged the market down.
Despite improved risk sentiment and declining Treasury yields, S&P 500 and U.S. stock futures failed to hold gains as large-cap tech stocks dragged the market down. The U.S. Treasury auctioned $58 billion in 3-year notes at a high yield of 4.152%, but investor caution increased due to market uncertainty surrounding the upcoming U.S. presidential election.

Concerns Over Tech Sector Resiliency
Major indexes reflected this sentiment: the Dow dropped 257 points (-0.6%), the S&P fell 16 points (-0.3%), and the Nasdaq declined 560 points (-0.2%). Last week’s weaker-than-expected earnings reports raised doubts about the tech sector’s strength. Once a primary driver of market gains, large-cap tech is now pressuring stock indices, and these disappointing results, combined with economic and political challenges, may signal further downside risk for the sector.
Closing Levels for Main US Indices
- Dow Jones Industrial Average: -257.60 points (-0.61%) at 41,794.60
- S&P 500: -16.11 points (-0.28%) at 5,712.69
- Nasdaq Composite: -59.93 points (-0.22%) at 18,179.98
- Russell 2000 (Small Cap): +8.90 points (+0.40%) at 2,219.03
Heightened Geopolitical and Economic Uncertainty Weigh on US Indices
In addition to economic concerns, geopolitical uncertainties are growing, particularly in the Middle East. Investor caution has been amplified by increased tensions following recent actions by Israel, underscoring the global impact of both political and economic instability on market sentiment.
Key Details of the U.S. Treasury 3-Year Note Auction
- Auction Amount: $58 billion of 3-year notes
- High Yield: 4.152%
- When-Issued (WI) Level at Auction: 4.143%
- Tail: 0.9% (compared to the 6-month average of -0.2%)
- Bid-to-Cover Ratio: 2.60x (6-month average: 2.57x)
Participation by Buyer Type
- Direct Bidders: 9.6% (below 6-month average of 15.7%)
- Indirect Bidders: 70.6% (above 6-month average of 66.5%)
- Dealers: 19.75% (above 6-month average of 15.76%)
Auction Grade: D+
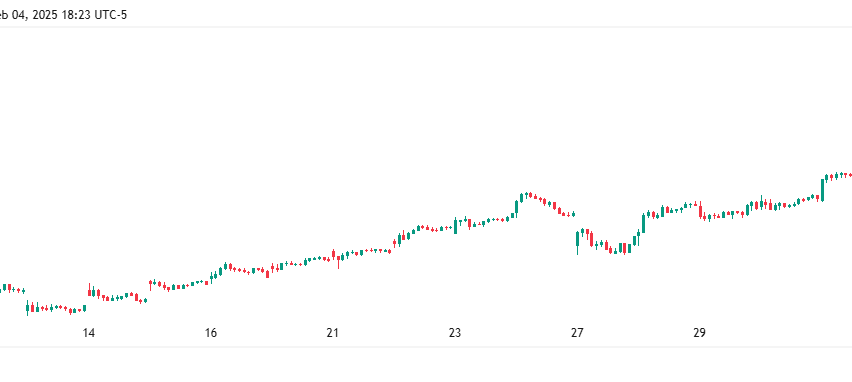
S&P 500 Live Chart
- Check out our free forex signals
- Follow the top economic events on FX Leaders economic calendar
- Trade better, discover more Forex Trading Strategies
- Open a FREE Trading Account
- Read our latest reviews on: Avatrade, Exness, HFM and XM
Related Articles


Sidebar rates
Related Posts
Add 3440


