UK House Prices Pick Up Again As BOE Lowers Rates – GBP-USD Tests Support at 1.27
GBPUSD made an important bearish break on Tuesday after the jump in the UK Unemployment Rate and now it is testing the next support zone.

GBPUSD made an important bearish break on Tuesday after the jump in the UK Unemployment Rate and now it is testing the next support zone.

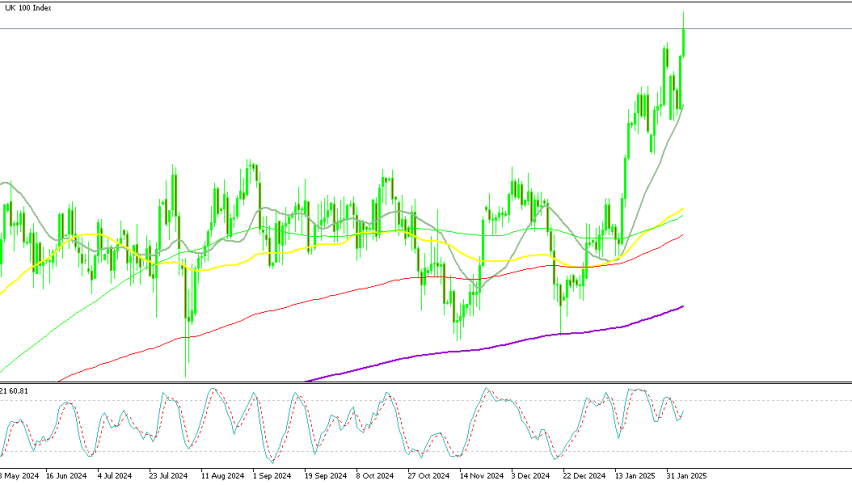
After a strong rally earlier this year, lifting GBP/USD above 1.34, October saw a sharp reversal as renewed USD buying pressure pushed the pair down by 7.5 cents. In the daily chart, the decline initially found support around the 100-day SMA, with this level holding up twice over the last two weeks.
GBP/USD Chart Daily – The 200 SMA Unlikely to Hold As Support
However, the 20-day SMA has acted as resistance, rejecting upward attempts and contributing to a further drop this week, breaking below the 100-day SMA. Despite brief support from the 200-day SMA, GBP/USD ultimately closed below 1.27 following four straight days of declines.
US CPI Inflation Spike Extends GBP/USD Downtrend
October’s CPI report showed an end to the six-month trend of slowing inflation in the U.S. The headline CPI rose to 2.6% year-over-year, up from 2.4% in September, while the core CPI also rose to 3.3% from 2.6% annually, with a monthly increase of 0.3%. This stronger-than-expected inflation data bolstered the dollar, driven by hawkish remarks from Fed officials emphasizing a potential rise in the neutral rate, further supporting USD demand.
UK Employment Data Highlights Job Market Weakness
In the UK, labor market data released Tuesday revealed signs of strain. The ILO unemployment rate for September climbed to 4.3%, up from the prior 4.1% forecast. Employment change was down, with 219,000 jobs added in September compared to August’s 373,000, while average weekly earnings grew modestly to 4.3% from 3.9%. Excluding bonuses, however, wages fell to 4.3% from 4.9%. Additionally, October payrolls declined by 5,000, following a 9,000 decrease in the previous month.
UK RICS House Price Balance Indicator
-
October House Price Balance:
- Reported at 16%, which exceeded the expected 12%.
- Indicates a stronger-than-anticipated increase in house prices.
-
Previous Month Comparison:
- September’s House Price Balance stood at 11%.
- The October figure shows a continued upward trend in house price growth, with a 5% increase from the prior month.
GBP/USD Live Chart
- Check out our free forex signals
- Follow the top economic events on FX Leaders economic calendar
- Trade better, discover more Forex Trading Strategies
- Open a FREE Trading Account
- Read our latest reviews on: Avatrade, Exness, HFM and XM
Related Articles
Sidebar rates
Related Posts
Add 3440


