Ethereum Technical Analysis Points to Potential Bull Trap Near $2.8K
Ethereum (ETH) is at a turning point since market signals show a mixed picture of cautious optimism balanced with major negative dangers.
Live ETH/USD Chart

Ethereum (ETH) is at a turning point since market signals show a mixed picture of cautious optimism balanced with major negative dangers. Although options markets show medium-term positive attitude, technical study points to the probability of a bull trap developing close to the $2,800 resistance level.

ETH Options Market Shows Bullish Bias
With over 70% of open interest focused in call contracts, Ethereum’s options market’s structure has a clearly optimistic tilt. With regard to striking prices between $3,000 and $4,000, traders especially pay close attention; February and March expirations also receive much thought. With 22% of block trades in put options, which suggests continuous worries about possible downside risks, big investors are keeping cautious stances however.
Goldman Sachs Holds Nearly $200M in Ethereum ETFs
With about $196.3 million in Ethereum ETFs, Goldman Sachs has become a large institutional participant in the Ethereum market in a noteworthy turn-about. Signifying increasing institutional confidence in the asset, this includes significant holdings in the Fidelity Ethereum Fund (FESH) and Grayscale Ethereum Mini Trust ETF.
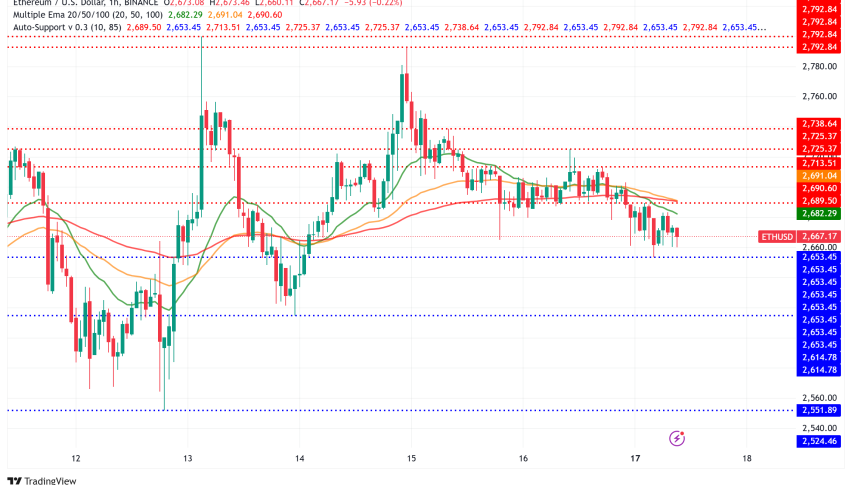
ETH/USD Technical Analysis: Key Levels to Watch
ETH/USD encounters immediate resistance at $2,800, the level that proved difficult to reach from August to November 2024. At $3,500, a more notable resistance exists; still, given present state of the market, this target seems far away. The support level at $2,600 is absolutely vital since breaking below might set off over $500 million in leveraged short liquidations across exchanges.
Technical Indicators and Market Metrics
After a dramatic early February drop, the Ethereum Estimated Leverage Ratio (ELR) has since demonstrated strength, recovering. Corresponding with a price recovery from $2,500 to $2,700, Open Interest has risen from $13.3 billion to $14.2 billion. Though this might not be enough to turn the present bearish trend reverse, large movements of ETH off of exchanges point to continuous accumulation.
Risk Factors
Several risk factors warrant attention:
- A break below $2,600 could trigger cascading liquidations
- Geopolitical trade tensions between the US and China may impact market sentiment
- The current price remains approximately 44% below the all-time high of $4,890 from November 2021
The general market structure stays bearish even if short-term signs point to possible higher movement toward $2,880. Near the $2,800 resistance level especially, traders should approach any rallies carefully. Although institutional involvement and infrastructural development offer some basic support, technical signs point to keeping a cautious posture short term.
Ethereum Price Forecast
Though this advance may prove to be a bull trap, short-term technical study indicates a possible bounce toward $2,880. The market structure is still gloomy, and purchasing activity seems to be stagnate. Although the presence of notable liquidation levels between $2,800 and $2,880 could function as a price magnet, traders should exercise caution of a possible bearish reversal following any surge to these levels.
Further complicating the market, Ethereum’s ecosystem is changing in response to Vitalik Buterin’s latest idea for a universal light client meant to simplify the network’s roll-up-centric scaling approach. This evolution might improve decentralization and network efficiency, therefore influencing long-term value propositions.
- Check out our free forex signals
- Follow the top economic events on FX Leaders economic calendar
- Trade better, discover more Forex Trading Strategies
- Open a FREE Trading Account
Related Articles


Sidebar rates
Related Posts
Add 3440

Best Forex Brokers
| Broker | Website | |
|---|---|---|
| 🥇 |  | Visit Broker |
| 🥈 | Visit Broker | |
| 🥉 |  | Visit Broker |
| 4 |  | Visit Broker |
| 5 |  | Visit Broker |
| 6 | Visit Broker | |
| 7 | Visit Broker |
